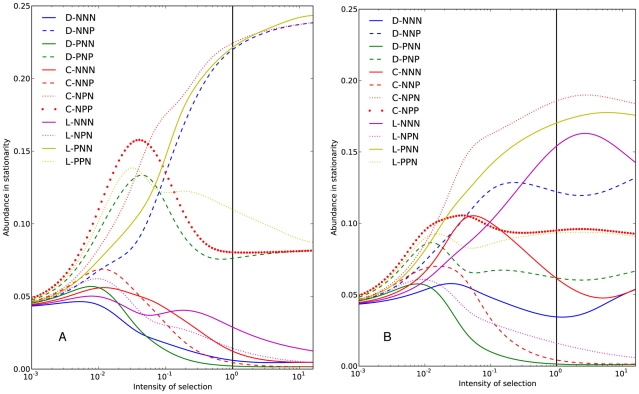
Figure 6. Optional public goods game with bitwise-like mutations.
Abundance in stationarity as a function of the intensity of selection ( ,
,  ,
,  ,
,  ,
,  ). Panel A shows results for uniform mutation structure. Panel B shows results for bitwise-like mutations. The reference intensity of selection (
 ) is marked with a vertical black line.

