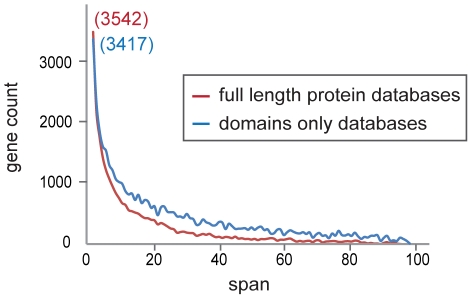
Figure 3. Metrics based on whole gene sequence similarity versus common domains.
Frequencies of distances between genes within paraclusters as described by the combination of data from PANTHER, Ensembl family and Ensembl paralogy datasets (red) and as described by the combination of a data from SCOP and InterPro datasets (blue). The numbers in parentheses are the number of paraclusters with only two genes.

