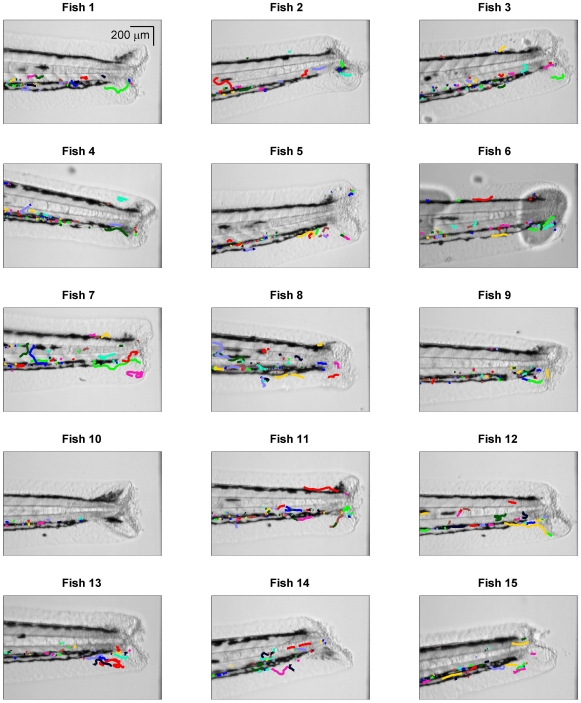
Figure 2. Neutrophil centroid position tracks.
The neutrophil tracks (colour lines) were obtained from a segmentation and tracking algorithm and are shown here in relation to the zebrafish image (greyscale), where the zebrafish image of dimension 1000 1000 pixels has been zoomed on the vertical axis to the 100–900 pixel range.

