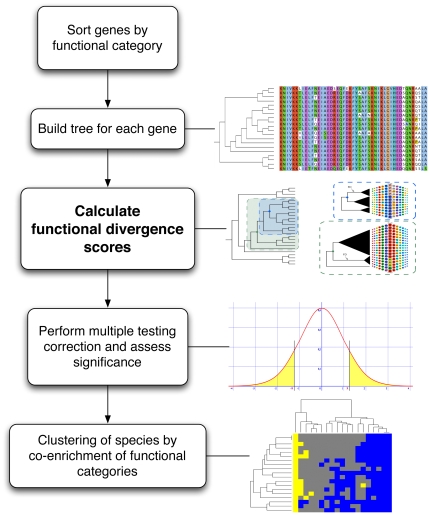
Figure 4. CAFS program workflow.
After alignments have been built for each gene in the analysis, the alignments are sorted by functional category. In this case, the COG system was used [38], but any other ontology can be used as well. Trees are built for each gene using BIONJ [76] and the JTT substitution model [77], and sites are scored for functional divergence on each branch. Significance is assessed by simulating a distribution of test scores under a model of neutral evolution, taking the real phylogeny into account and using the False Discovery Rate approach to correct for multiple testing. For each species and functional category, we use chi-squared tests to evaluate whether the species is enriched or impoverished for functional divergence in that category, and then cluster species according to similarities in their profile across all 19 categories. This approach enables us to account for HGT while identifying interesting and atypical patterns of functional change in the data, as discussed in the main text.

