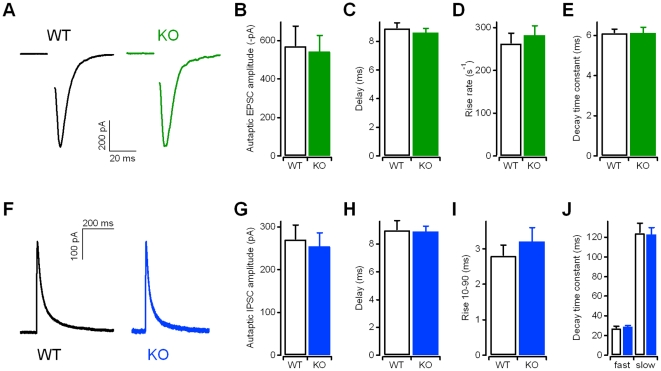
Figure 2. Excitatory and inhibitory post-synaptic currents recorded from autaptic Kidins220−/− neurons showed normal amplitudes and kinetics.
A) Representative eEPSC recordings in WT and KO autaptic neurons in response to brief depolarization. Stimulus transients have been removed for clarity. Holding potential −86 mV. B) eEPSC amplitudes recorded from autaptic neurons (n = 52 for WT; n = 45 for KO). C) Delay times were determined as the time between the stimulus and the peak of the EPSC response. D) The rise rate as a measure of the activation kinetics was determined from the slope of the EPSC's rising phase. E) The time constant of EPSC deactivation was determined by fitting the EPSC decay phase with a mono-exponential function. F) Representative eIPSC recordings in WT and KO neurons in response to brief depolarization. Stimulus transients have been removed for clarity. Holding potential −66 mV. G) eIPSC amplitudes recorded from autaptic neurons (n = 36 for WT; n = 29 for KO). H) Delay times were determined as the time between the stimulus and the peak of the IPSC response. I) The rise time (from 10% to 90% of the IPSC amplitude) was determined from the rising phase of IPSC. J) Fast and slow time constants of IPSC deactivation were determined by fitting the IPSC decay phase with a bi-exponential function. For the data in C–E and H–J, n = 20 for both WT and KO. None of the analyses revealed significant differences (p>0.05; unpaired Student's t-test). See the Methods section for details on the determination of current kinetics.

