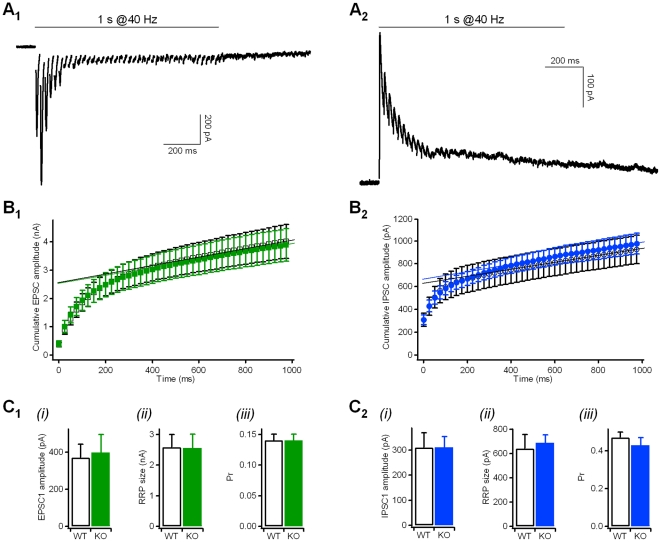
Figure 3. Cumulative amplitude profile analyses did not reveal differences in RRP sizes and vesicle release probabilities between wild type and Kidins220−/− neurons.
A) Representative current traces (EPSCs in A1; IPSCs in A2) in response to a 1-s stimulation train at 40 Hz. Holding potential −86 mV in A1, −66 mV in A2. B) Cumulative amplitude profile of EPSCs (B1) and IPSCs (B2) during repetitive stimulation at 40 Hz for 1 s (see current traces in A). Currents were recorded from autaptic neurons, with n = 16 WT (open squares), n = 15 KO (filled squares) for EPSC data, and n = 13 WT (open circles), n = 16 KO (filled circles) for IPSC data. Data points between 600 and 1,000 ms were subjected to a line fit to estimate the size of the cumulative EPSC/IPSC amplitude before steady-state depression (see below). C) The parameters derived from the cumulative amplitude profile analyses in B did not differ between WT and KO neurons (p>0.05; unpaired Student's t-test): (i) the amplitude of the first autaptic EPSC (C1) and IPSC (C2) in the train; (ii) the cumulative current amplitude before steady-state depression (indicating the size of the readily releasable pool (RRP)) estimated from the intercept of the line fit (in B) at t = 0 s; (iii) the vesicle release probability (Pr) calculated as the ratio between EPSC1/IPSC1 (see i) and the respective RRP size (see ii).

