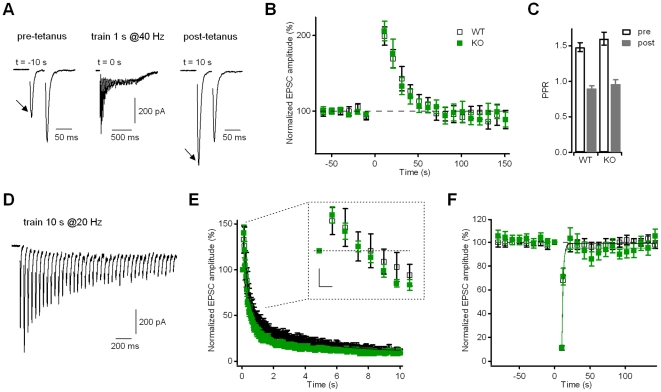
Figure 5. Neurons from Kidins220−/− mice showed normal post-tetanic potentiation and synaptic depression of evoked EPSCs.
A) EPSCs recorded using a paired-pulse protocol (IPI = 50 ms) are presented before (left trace) and after (right trace) the application of a 1-s stimulation train at 40 Hz (middle trace). The increase of the EPSC1 amplitude (arrows) is connected to a decrease of the paired-pulse ratio. Holding potential −86 mV. B) Time course of post-synaptic currents (in % of baseline) recorded at a stimulation frequency of 0.1 Hz. Tetanic stimulation (as in A) was applied at t = 0 s. EPSCs displayed post-tetanic potentiation with a peak at 10 s after the end of tetanic stimulation. There was no significant difference between WT and KO cells (n = 22 for both groups; p>0.05, unpaired Student's t-test). C) The paired-pulse ratio of EPSC recordings for both WT and KO neurons (n = 22 for both groups; p>0.05, unpaired Student's t-test) changes from facilitation in the baseline condition (pre) to depression at the 10-s time point after tetanic stimulation (post). D) Representative EPSC trace in response to a 10-s stimulation train at 20 Hz to induce synaptic depression. Only the first 2 s corresponding to 40 pulses are shown for clarity. Holding potential −86 mV. E) Time course of EPSC responses during the application of a 10 s @20 Hz train. Data were normalized to the amplitude of the first current response in the train. There was no significant difference between WT and KO cells (n = 16 for both groups; p>0.05, unpaired Student's t-test). Continuous lines represent best fits with a bi-exponential function. The inset illustrates the transient increase of the EPSC amplitude during the first pulses of the train on an expanded scale. Scale bars 50 ms/20%. F) Recovery from depression of EPSC responses was followed at a stimulation frequency of 0.1 Hz. All data points were normalized to the amplitude of the first current response in the train (applied at time point 0). There was no significant difference between WT and KO cells (p>0.05, unpaired Student's t-test). Lines represent best-fits with a mono-exponential function.

