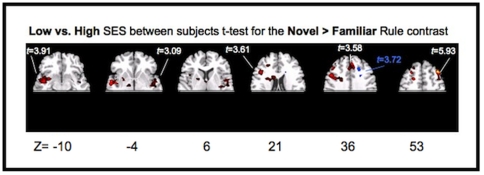
Figure 6. Significantly active areas (p<.05, cluster level corrected) for the two sample t-test comparing children from low socioeconomic status families to children from high socioeconomic status families for the novel rule > familiar rule contrast.
Activation in red represents areas that were more active for children from low socioeconomic status families during learning. Activation in blue represents areas more active for children from high socioeconomic status families during learning. Circled in red is the RMFG, which survived further correction at p<.001 cluster level correction.

