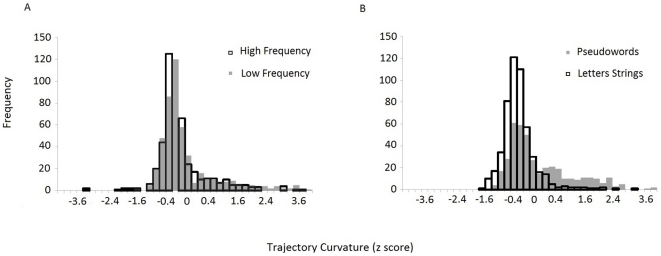
Figure 3. Distributions of trajectory curvature.
a) Overlaid histograms of trajectory curvature for Lexical stimuli as measured by z scored values of AUC. High Frequency words exhibit unimodal distribution, whereas Low Frequency stimuli exhibit bimodality, with a first local maxima between a −.8 and −.4 z-score, and a second smaller mode between a .4 and .8 z-score. b) Overlaid histograms of trajectory curvature for Non Lexical stimuli as measured by z scored values of Area Under the Curve. Letters Strings have unimodal distribution. Pseudowords show bimodality with the first local maxima between a −.1 and −.4 z-score, and a second smaller mode between a .2 and .6 z-score.

