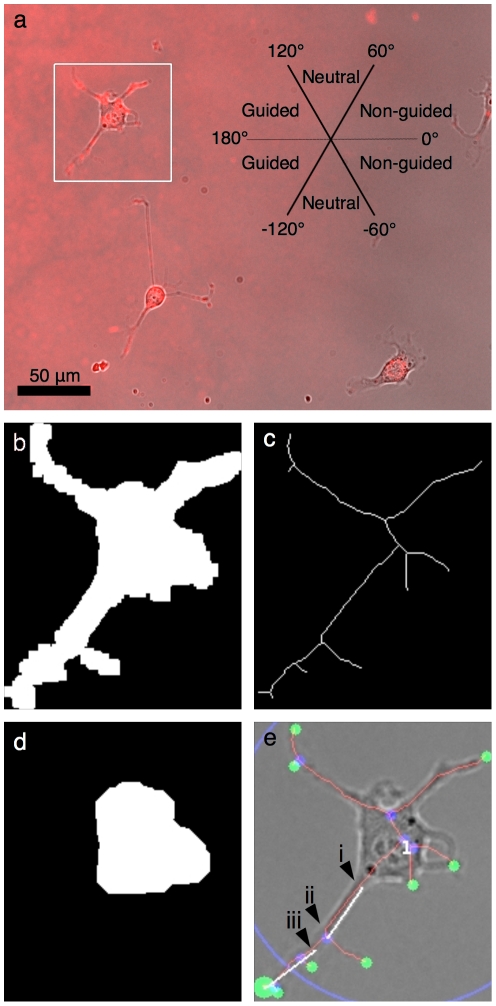
Figure 2. Image analysis algorithm key steps.
RGC-5 cells on a low-slope laminin-1 gradient where a streptavidin-Cy5 gradient was imaged by fluorescence microscopy with cells in bright field mode using a 20× 0.75 NA objective. (a) The properties of the longest neurite of each cell were classified as attracted, neutral or repulsed. (b–e) In order to study thousands of cells, classify them in an objective manner and collect information about each cell, an automated analysis algorithm was written in MATLAB™. Key steps of the algorithm are depicted here for the cell denoted by the white square in panel (a). (b) First, a Sobel filter, dilation, elimination of small objects and filling of remaining object was used to define a mask for each cell. (c) A skeleton was computed by performing a thinning of the mask corresponding to each cell until minimally connected lines were obtained. (d) A morphological opening of the mask was then performed to find the region corresponding to the soma and then its centroid (marked by the upper left position of the number in panel e). (e) The position of all end-points (green) and intersection-points (blue) of the skeleton were determined. The position of the most distal end-point (large green disk) relative to the soma's centroid and the length of the corresponding skeleton branch were computed, as well as the initiation angle and the terminal angle.

