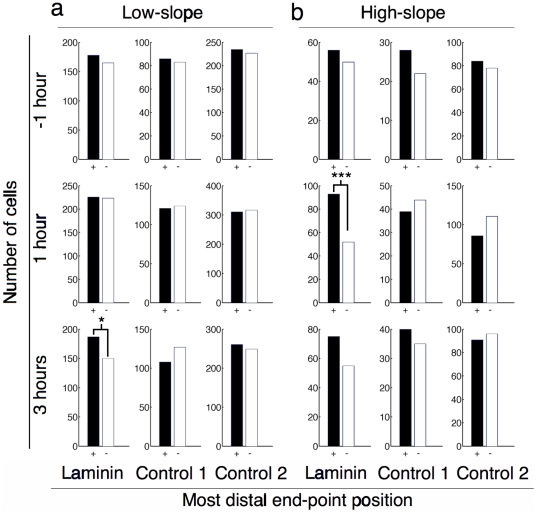
Figure 3. Neurite extension bias according to most distal end-point.
Histograms of most distal end-point relative to soma centroid position for all cell images in both low-slope and high-slope gradients at time points before and during differentiation with staurosporine. Attracted (black, +) and repulsed (white, −) neurites were determined as described in Figure 2a. Low-slope gradients resulted in statistically significant guidance for laminin-1 three hours after differentiation (p = 0.044 by χ2). High-slope gradients resulted in guidance that was statistically significant at 1 hour (p = 0.0006 by χ2) after differentiation by staurosporine.

