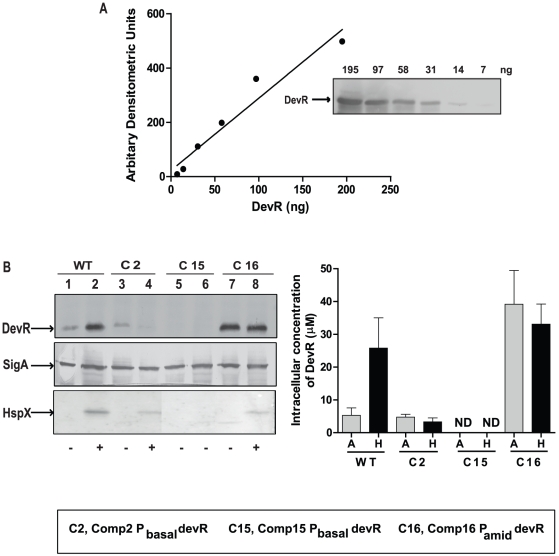
Figure 3. Estimation of intracellular concentration of DevR.
(A) A standard curve for DevR protein was generated using purified DevR protein and quantitative Western blotting. (B) M. tb lysates (15 µg protein) were electrophoresed and subjected to immunoblot analysis in parallel with purified DevR protein using polyclonal antibodies to DevR, SigA (not shown) or HspX (lower panel). ‘−’ and ‘+’ indicate absence and presence of HspX expression. In all panels, lanes 1, 3, 5 and 7 represent aerobic cultures and lanes 2, 4, 6 and 8 represent hypoxic cultures. The immunostained blots were scanned and analyzed with software Quantity One. The data are the averages of two independent determinations. ND, not detected.

