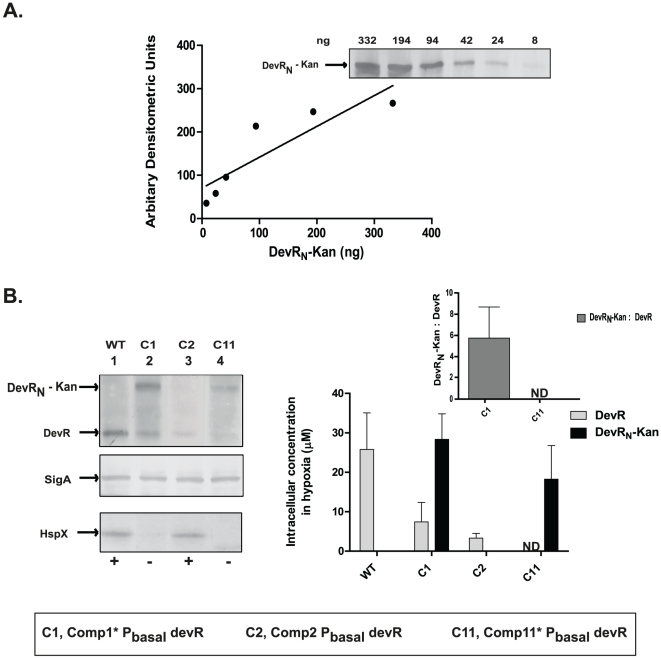
Figure 4. Estimation of intracellular DevRN-Kan and DevR concentration in M. tb under hypoxia.
(A) A standard curve was generated for DevRN-Kan protein as for DevR protein. (B) M.tb lysates prepared from hypoxic cultures (15 µg) were electrophoresed and analyzed by immunoblotting as described in the legend to Figure 3. ‘−’ and ‘+’ indicate absence and presence of HspX expression. Inset, Ratio of normalized DevRN-Kan and DevR proteins in various Comp strains. The values shown are the averages of two independent determinations.

