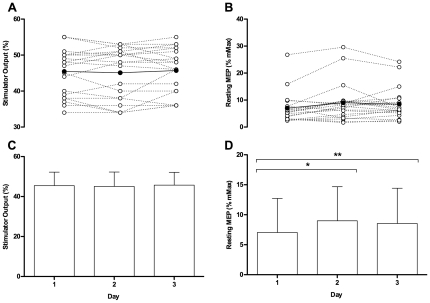
Figure 1. Individual resting motor threshold as a percentage of stimulator output.
Clear dots represent individual participants whilst filled dots represent mean data (A). Individual and mean resting motor evoked potentials (MEPs) (B). Mean resting motor threshold (C) and mean resting MEPs as a percentage of Mmax (D) on day1, 2, and 3. *(P = 0.016) and **(P = 0.046) denotes significant difference.

