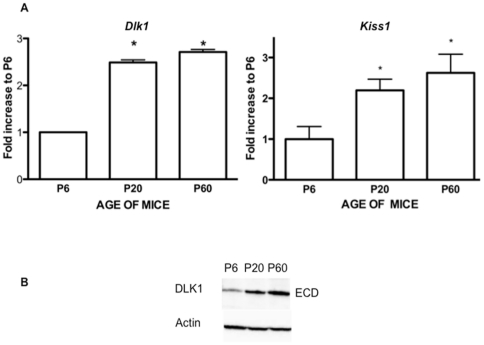
Figure 4. Dlk1 expression increases in the hypothalamus between birth and adulthood.
A) Total hypothalamic RNA was extracted on post-natal days 6, 20 and 60 (P6, P20, P60). mRNA levels were quantified using real-time RT-PCR as described in the materials and methods section. The graphs show fold increases in expression at P20 and P60 compared to P6. Kiss1 expression was quantified using real-time RT-PCR as described in the materials and methods section. The graphs represent pooled data (mean ± SEM) from three different experiments with 4 mice per group. *indicates a significant increase (p<0.01) relative to P6. B) DLK1 protein levels on P6, P20 and P60 were evaluated using western blot on total cellular extracts with the H-118 antibody.

