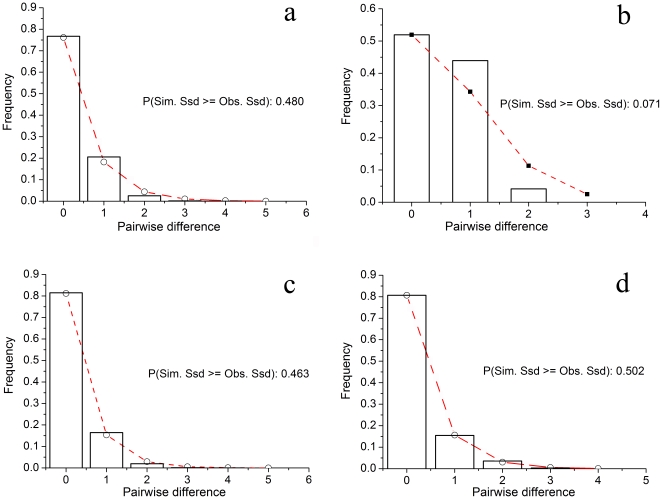
Figure 4. Observed pairwise differences and expected mismatch distribution.
Observed pairwise differences (bars) and the expected mismatch distributions (line) under the sudden expansion model of COI gene. (A) in all samples, (B) in Yellow Sea group, (C) in East China Sea group and (D) in South China Sea group.

