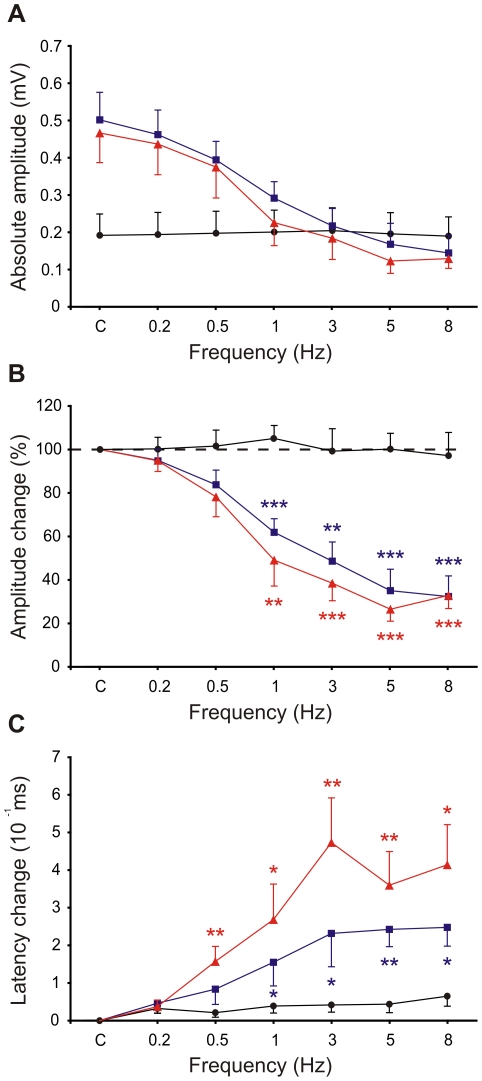
Figure 6. Changes in amplitude and latency of evoked local field potential components along the whisker stimulation frequency range.
(A) Absolute amplitude of postsynaptic components at stimulations of 0.2, 0.5, 1, 3, 5, and 8 Hz. Changes in mean amplitudes (B) and latencies (C) compared to control conditions were induced by stimulation frequencies of 0.2, 0.5, 1, 3, 5, and 8 Hz. N1 (black circles), N2 (blue squares), and N3 (red triangles) components are expressed as mean±SEM. Significant differences (asterisks) were evaluated for the postsynaptic components (N2 and N3) with respect to the presynaptic input (N1). (p<0.001, ***; p<0.01, **; p<0.05, *).

