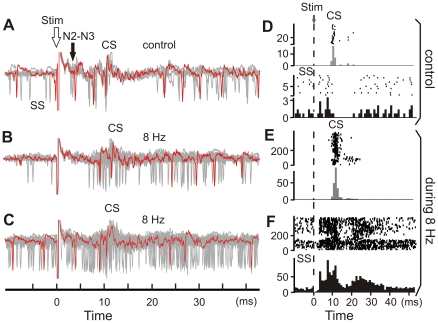
Figure 9. Simple and complex spike firing behavior before and during the 8-Hz electrical stimulus train.
(A) Superimposed single stimulus (Stim, open arrow) trials under control conditions, before the 8-Hz stimulation. Note the SS evoked responses at the latency of the N2–N3 local field potential components (N2–N3, filled arrow). (B, C) Superimposed single traces during two 8-Hz stimulation protocols. In each case (A–C), the stimulations (Stim, open arrow) are aligned for comparisons. Single trace appears in color to facilitate the identification of SS and CS. Of note, (B) the early evoked SS is absent, and (C) the evoked SS is desynchronized compared to the control situation (A). (D) Raster sweeps (top) and related histograms (bin size = 1 ms, bottom) of the CS (upper part) and SS (lower part) evoked responses in control conditions. (E, F) Raster sweeps (top panels) and histograms (bin size = 1 ms, bottom panels) of (E) the CS and (F) SS evoked responses during the 8-Hz stimulation.

