Abstract
Purpose: The authors present a calibration method for a prototype proton computed tomography (pCT) scanner. The accuracy of these measurements depends upon careful calibration of the energy detector used to measure the residual energy of the protons that passed through the object.
Methods: A prototype pCT scanner with a cesium iodide (CsI(Tl)) crystal calorimeter was calibrated by measuring the calorimeter response for protons of 200 and 100 MeV initial energies undergoing degradation in polystyrene plates of known thickness and relative stopping power (RSP) with respect to water. Calibration curves for the two proton energies were obtained by fitting a second-degree polynomial to the water-equivalent path length versus calorimeter response data. Using the 100 MeV calibration curve, the RSP values for a variety of tissue-equivalent materials were measured and compared to values obtained from a standard depth-dose range shift measurement using a water-tank. A cylindrical water phantom was scanned with 200 MeV protons and its RSP distribution was reconstructed using the 200 MeV calibration.
Results: It is shown that this calibration method produces measured RSP values of various tissue-equivalent materials that agree to within 0.5% of values obtained using an established water-tank method. The mean RSP value of the water phantom reconstruction was found to be 0.995 ± 0.006.
Conclusions: The method presented provides a simple and reliable procedure for calibration of a pCT scanner.
Keywords: proton, imaging, tomography, calibration
INTRODUCTION
Proton computed tomography (pCT), i.e., the reconstruction of tomographic images with protons of sufficient energy to penetrate a patient, was originally proposed by physicist Allan Cormack.1 During the 1970s, Cormack and Koehler2 and a few years later Hanson et al.3, 4 performed first experimental studies with pCT. Hanson et al. measured the proton energy loss of protons traversing the object from multiple directions around the object to reconstruct relative stopping power (RSP) with respect to water in a tomographic fashion. It was found that it had a dose advantage when compared to x-ray CT.
PCT is potentially more accurate than x-ray CT in providing RSP distributions in the patient without the need for converting Hounsfield units to RSP, and may, therefore, be used instead of x-ray CT for proton treatment planning. Zygmanski et al.5 built a pCT system using traversing proton beams with depth dependent modulation, thus relating proton fluence to water-equivalent path length (WEPL), rather than measuring energy loss. However, their system suffered from a relatively high level of noise and poor spatial resolution. In 2003, a pCT collaboration was formed with the goal to perform design and simulation studies of pCT and to build a pCT scanner prototype.6, 7 It was decided to follow the original approach by Hanson4 and measure energy loss of protons. In addition, detector technology borrowed from high-energy physics was chosen with the aim to register individual protons at high data rates.8 In the following years, a series of publications related to pCT documented the progress made in the development of pCT technology9, 10, 11, 12, 13 and image reconstruction.14, 15, 16, 17, 18 In 2010, a pCT scanner prototype was completed that can be used on phantoms of head size to characterize the performance of pCT. The system is currently installed on the research proton beam line of the medical proton synchrotron at Loma Linda University Medical Center.
Protons can also be used to perform proton radiography, i.e., 2D imaging with protons traversing the patient. By measuring the energy loss or residual range of protons after they interacted with the patient, the WEPL distribution across the object can be inferred. Proton radiography has been proposed as a tool for quality assurance in x-ray-CT-planned proton treatment19 or to quantify proton range variations during respiration.20 A system for proton radiography was subsequently constructed at the Paul Scherrer Institute.21, 22 Several proton radiography systems are currently under development.23, 24, 25
Both pCT and proton radiography, when based on measurement of energy loss or residual range of protons traversing the patient, require the conversion of the detector response to an integral of the object’s RSP along the path l of the proton. This integral is equivalent to the WEPL, L
| (1) |
where ϱ is defined as the ratio of the local stopping power of the material, , to the stopping power of water,
| (2) |
One should note that, for proton energies in the range between 30 and 250 MeV, the variation of RSP with proton energy is negligible. For example, for brain tissue (as defined by the ICRP) the difference of the RSP at 30 and 200 MeV is only 0.07%. For practical purposes, one can, therefore, consider ϱ as independent of proton energy.
Assuming that the residual energy of protons is known, an estimate of the WEPL can be obtained by numerically solving the integral of the reciprocal of the stopping power of protons in water10, 16
| (3) |
where is the incoming energy of the proton and is the outgoing energy. is the stopping power of water for protons of energy E and is the mean excitation energy of water. The stopping power in the energy range above 10 MeV is described appropriately by the Bethe–Bloch equation.
The use of Eq. 3 requires knowledge of the outgoing energy of protons after traversing the patient. Schneider and Renker26 reported a method for calibrating the nonlinear response of a NaI(Tl) scintillator intended for proton radiography. The authors used response data of NaI(Tl) to energetic protons measured by Romero et al.27 to build an analytical calibration model. In this paper, we describe an alternative approach of calibrating the response of the CsI(Tl) scintillator calorimeter incorporated in the current pCT against the known water-equivalent thickness (WET) of polystyrene degrader plates. The performance of this calibration method was tested by measuring the RSP of a variety of tissue-equivalent materials and by reconstructing the RSP of a water phantom using a calibrated pCT scan.
METHODS AND MATERIALS
The pCT scanner prototype
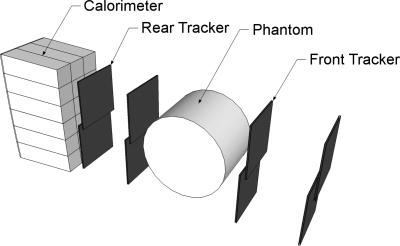
The prototype pCT scanner consists of two principal components: (1) the silicon tracker for tracking the paths of individual protons and (2) the segmented cesium iodide crystal calorimeter for measuring the residual energy of individual protons after passing through the image object. A schematic representation of the system is shown in Fig. 1.
Figure 1.
Schematic drawing of the pCT scanner prototype. The detector system consisting of silicon tracker planes and a segmented crystal calorimeter is exposed to a horizontal proton cone beam (not shown) generated by a thin lead foil located downstream of the proton beam line exit window. The phantom is located between the front and rear telescopes and is rotated in discrete angular steps during a pCT scan.
Silicon tracker
The tracker is comprised of 16 individual silicon strip detectors arranged into four X- and Y-resolving planes, each with a sensitive area of 8.95 × 17.4 cm2. The silicon strip detectors have a strip pitch of 228 μm. To achieve a continuous sensitive area without any gaps, the detectors in a plane are overlapped slightly. This is visible in Fig. 1. The planes are separated into two “telescopes” positioned before and after the object to measure the position and direction of individual protons as they enter and exit the object.
Energy detector
The energy detector of the pCT scanner prototype is a calorimeter consisting of 18 thallium-doped cesium iodide (CsI(Tl)) crystals arranged to form a 3 × 6 rectangular matrix encompassing the sensitive area of the tracker.12 There are several reasons for the segmented rather than monocrystal design: (1) with a segmented calorimeter in combination with the tracker it is possible to calibrate the response of individual crystals decreasing the effect of nonuniformity across the calorimeter, (2) the cross section of individual crystals matches that of the individual photodiodes, thus maximizing light collection efficiency, and (3) segmenting the calorimeter reduces the pile-up rate thus increasing the proton counting rate. The individual crystals are 12.5 cm long, which is sufficient to stop protons of 200 MeV. The residual energy of protons stopping in the calorimeter is converted to light by scintillation. The light is then collected by a photodiode paired to each crystal and a conversion to a digital value is performed with an analog digital converter (ADC).
Data acquisition System
An FPGA-based data acquisition (DAQ) system processes and records both the tracking and energy information at a maximum rate of approximately 105 protons per second. With higher proton rates, the pile-up rate increases, reducing the overall acquisition rate of useful proton histories. When optimizing the proton rate for maximum efficiency, the pCT scan of a 15 × 4 cm cylindrical phantom takes 4–5 h with this prototype.
Image reconstruction
The main difference between the current concept of pCT and previous approaches to pCT reconstruction4, 5 is that it is based on energy loss measurements of single protons rather than averaging the energy loss of multiple proton histories, and that it uses the most likely path (MLP) concept15 for an iterative reconstruction algorithm, thus taking into account the curved proton path to produce tomographic reconstructions with sufficient spatial resolution, despite the effect of multiple Coulomb scattering.
The MLP concept allows the use of reconstruction algorithms based on series expansion methods.28 One can precede this reconstruction by a fast, but less accurate reconstruction based on filtered back projection (FBP), which also results in knowledge of the outer contour of the object in reconstruction space and provides entry and exit points for the MLP calculation. With this knowledge, and using the FBP solution as the initial iterate, the image reconstruction proceeds as follows (Fig. 2).
Figure 2.
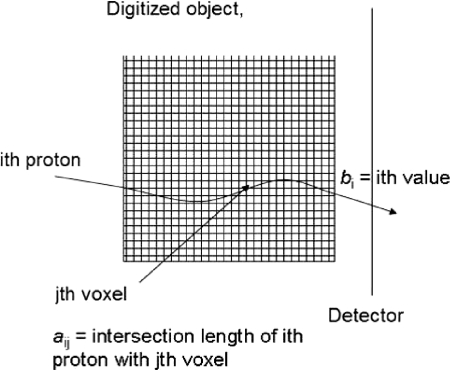
Derivation of the system matrix of the pCT reconstruction problem using the reconstructed MLP of each proton.
Assume the image space is digitized, forming an m-dimensional vector of initially unknown RSP values of the object. As mentioned, the FBP vector can serve as the initial estimate. A total number of n proton histories traversing the object is collected and the MLP of each history is calculated from tracker information (entry point and direction and exit point and direction). In addition, one obtains the WEPL of each proton from the calorimeter response. The set of all WEPL values forms the n-dimensional vector . The MLPs are also digitized and expressed as a matrix row vectors where i is the index of the proton () and j is the object voxel index (). The matrix A composed of these vectors is the ”system matrix” of the linear equation system
| (4) |
where the elements correspond to the length of intersection (chord length) of the ith proton MLP with the jth voxel. In realistic pCT reconstructions, the system of equations will be inconsistent due to noise and MLP uncertainty, and the matrix A will be very large ( and very sparse, i.e., with typically a few hundred nonzero row elements for each row.
The reconstruction problem is then reduced to finding a solution to the large linear system of Eq. 4. After initially using the algebraic reconstruction technique (ART),14 which is a sequential projection method, we have tested faster, parallelizable algorithms, which are suitable for implementation on fast graphics processing units (GPUs). Using GEANT4 simulations generating realistic pCT data sets, it has been shown that pCT reconstructions of good quality can be obtained.18 More recently, we have investigated the use of superiorization methods for pCT reconstruction leading to improved image quality.13
Calibration method
Overview
A calibration procedure has been developed in this work that converts the weighted sum of the calorimeter crystal signals derived from individual protons to a WEPL value. An analytical model has been used to describe the relationship between weighted sum of crystal responses and WET of the material the protons had traversed before being stopped in the calorimeter. Thus, the WET of degrader plates (their physical thickness multiplied by the RSP of the degrader material) is the controlled variable in this measurement, and the response of the calorimeter, which is subject to statistical variation, is the dependent variable. The uncertainty of the individual WEPL measurement can be derived by propagating the uncertainty of the calorimeter response into the analytical model predicting the corresponding WEPL value.
Calibration procedure
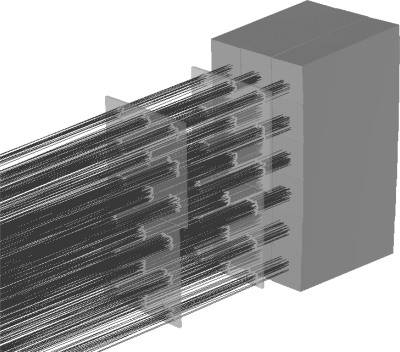
The calibration procedure developed for the pCT scanner consists of two distinct steps. In the first step, a relative weighting factor for each channel (crystal) of the calorimeter is determined. The pCT system is exposed to a cone beam of protons without any object between front and rear tracker. The cone beam is spread out using a lead foil of appropriate thickness (e.g., 1.9 mm for 200 MeV and 0.2 mm for 100 MeV) placed at the exit window of the beam line to ensure coverage of the calorimeter to the beam. Using information from the pCT trackers, proton events are selected that entered each crystal near the center and with an angle parallel to the crystal axis (Fig. 3). The relative weighting factor of the ith crystal (), is then defined as
| (5) |
where E is the beam energy at which the calibration is performed and is the average signal of the ith crystal. The factor 10 E was chosen (arbitrarily) so that, for example, the mean weighted sum of all crystal responses to a proton of 200 MeV is 2000.
Figure 3.
Example of tracks selected for individual crystal calibration.
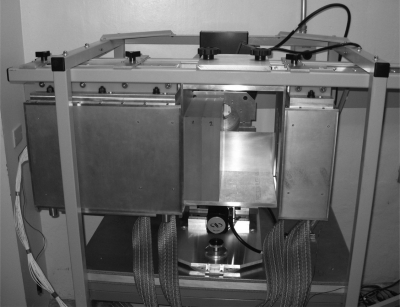
Figure 4 shows the setup for the second step of the calibration procedure. Degraders consisting of plates of polystyrene with a high degree of uniformity both in density and thickness are inserted between the front and rear tracker telescopes of the pCT prototype. A holder was made to ensure that the degrader blocks are positioned parallel to the detector planes and perpendicular to the beam axis. The RSP of the plate material was determined to be 1.0358 with the water-tank method described below. The thicknesses of the plates were measured to an accuracy of better than ±0.05 mm by taking the mean of ten random measurements across the plate with a digital height gauge. A wide range of different WET values between 0 and 26 cm (for 200 MeV) or 0 and 8 cm (for 100 MeV protons) can be produced by combining degrader plates of different available thicknesses.
Figure 4.
WET calibration set up with two polystyrene blocks. The beam enters from the right in this photograph. The enclosure on the right contains the front tracker, and the larger enclosure on the left contains the rear tracker and calorimeter.
Data acquisition and analysis
For the calibration at a given energy (e.g., 200 MeV), the pCT system with inserted degrader is exposed to a sufficiently wide proton cone beam. Tracking and calorimeter response data are collected for about 105 protons for each degrader WET step. A series of data reductions (“cuts”) are made to the response data of the calorimeter to individual proton events to exclude events where the proton was scattered out of the system, where pile-up occurred in the tracker (and therefore tracking information was ambiguous), where the proton did not pass through exactly eight layers of silicon, or where the calculated MLP length15 exceeded the known degrader thickness by greater than 0.5%.
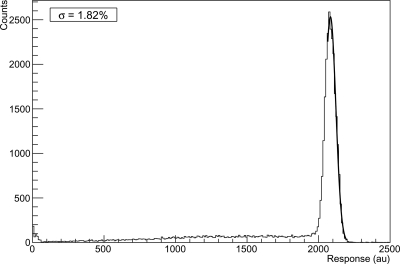
For the remaining proton events, the calorimeter response r is calculated by forming the weighted sum of crystal signals higher than above the noise floor using the weighting factors defined by Eq. 5. Only signals from crystals are included in the sum that is contiguous with the crystal displaying the largest response. Figure 5 shows a histogram of the summed calorimeter response (in arbitrary units) to a given degrader WET. The mean calorimeter response for each degrader thickness is found by fitting a Gaussian distribution to the peak of the distribution. To exclude the non-Gaussian low-energy back tail (which becomes more pronounced after protons went through a degrader of greater thickness) only the part of the spectrum that is symmetric with respect to the peak is included in this Gaussian fit, effectively removing the lower energy tail.
Figure 5.
Histogram of the calorimeter response to a 200 MeV beam with no degrader. The Gaussian fit of the right side of the peak is shown.
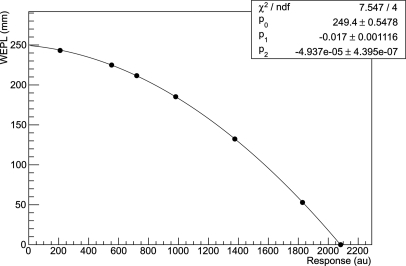
Guided by the form of the Bethe–Bloch equation, a second-degree polynomial has been chosen to describe the relationship between the mean calorimeter response r and WEPL L (represented by the WET of the degrader).
| (6) |
The parameters of the polynomial are found by fitting the function to the response data using a least-squares fitting procedure. Figure 6 shows an example of a fitted calibration curve using this method. This provides the calibration function for conversion of calorimeter response to WEPL for any proton event. Propagating the mean variance of the calorimeter response, , into the variance of the WEPL, the uncertainty of the individual WEPL measurement can be expressed as
| (7) |
Figure 6.
Calibration curve of calorimeter response versus water-equivalent path length for a 200 MeV beam. The curve was fitted with a second-degree polynomial.
Verification
To verify the calibration method, the WET of a set of tissue-equivalent plates (Gammex, Inc., Middleton, WI) was derived from the pCT scanner calibration curve obtained with 100 MeV protons and compared to results using a standard water phantom depth-dose range shift measurement. The tissue-equivalent degraders included 1 cm thick plates of muscle, adipose, brain, and compact bone material and a 2 cm thick plate of lung. Each plate was inserted into the scanner, one at a time, and approximately 30 000 proton histories were recorded with 100 MeV protons. The weighted calorimeter response for each plate was converted to WEPL using the 100-MeV calibration curve. The mean WEPL for each plate was found by fitting a Gaussian distribution to the converted WEPL values. The RSP, ϱ, was calculated using the formula
| (8) |
where is the physical thickness of the plate.
The standard water-tank measurements were performed with a beam energy of 186 MeV and a 60 mm modulation wheel to produce a spread out Bragg peak (SOBP). The range shift as a result of inserting the tissue plate into the beam path was then measured by scanning a Markus chamber along the beam axis inside a water phantom. The plates were placed outside the water-tank. The RSP, ϱ, was determined using the formula
| (9) |
where is depth to 50% ionization in water and is the depth to 50% ionization in water behind the plate.
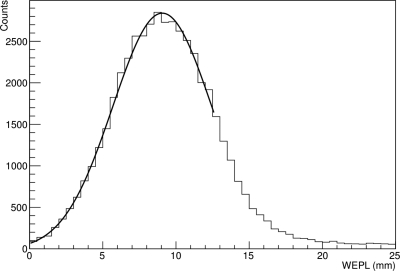
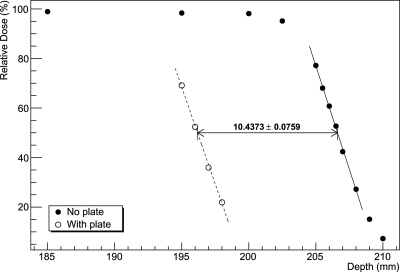
Figure 7 shows the WEPL distribution for the muscle equivalent plate, being representative of the distributions obtained with the other plates and Fig. 8 shows the shift of the distal edge of the Bragg peak from the same plate.
Figure 7.
WEPL distribution recorded using the pCT scanner for a 1 cm thick muscle equivalent plate.
Figure 8.
Depth-dose range shift measured using a water phantom for a 1 cm thick muscle equivalent plate.
A second test of the validity of the calibration procedure was performed by acquiring a pCT scan of an acrylic cylinder with 0.5 cm thick walls and 15 cm diameter filled with distilled water and degassed in a vacuum chamber. The phantom was scanned with a cone beam of 200 MeV protons in 90 angular steps over 360°. A total number of about 40 × 106 proton histories were utilized for the image reconstruction of RSP values across the phantom, as described above, using an iterative DROP algorithm combined with a superiorization of total variation as described previously.17 The phantom was reconstructed in 3D with a 16 × 16 × 8 cm3 reconstruction volume. The volume was divided into voxels of 0.625 × 0.625 × 2.5 mm3 size
RESULTS
Calibrations were obtained at two discrete initial energies: 200 and 100 MeV. The former energy was selected for scanning of objects in the 10–20 cm WET range, e.g., a head phantom or the water phantom, and the latter for objects less than 10 cm, e.g., for scanning a rat. The scanner calibration is performed daily or whenever changing initial energy.
Calibration uncertainty
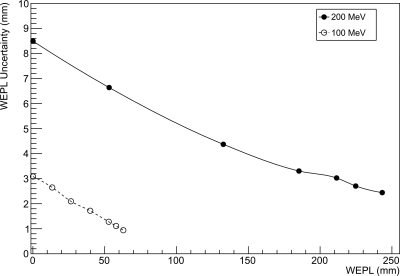
A typical calibration curve for 200 MeV protons is shown in Fig. 6. Figure 9 shows the dependence of the single-proton WEPL uncertainty, , on the WEPL value for beam energies of 100 and 200 MeV. Note that the uncertainty of a WEPL measurement with N protons scales with .
Figure 9.
Uncertainty of the single-proton WEPL measurement as a function of WEPL, for beam energies of 100 and 200 MeV, respectively.
As expected from Eq. 7, the WEPL uncertainty decreases for larger path lengths (hence, smaller response). The contribution of the spread of the initial proton energy to this uncertainty should be negligible; at 200 MeV, the momentum spread of the Loma Linda University proton synchrotron is about 0.01%,29 which translates to an energy spread of 0.040 MeV (1 σ). At zero or small WEPL (no or thin degrader), the uncertainty is due to a combination of intrinsic noise of the calorimeter and energy straggling in the materials between the accelerator and the calorimeter, including secondary emission monitor at beam exit, the vacuum exit window, lead scattering foil, air, and the silicon tracker modules. The combined energy straggling in these materials at 200 MeV energy is estimated to be 0.52 MeV (0.26%). As the relative uncertainty of calorimeter response at small WEPL is about 2%, the largest contribution to the uncertainty at small WEPL is the intrinsic resolution of the calorimeter, which is mostly defined by the process of light collection. Some additional uncertainty can arise from leakage of energy due to large-angle elastic scattering of primary protons and inelastic nuclear interactions in the calorimeter leading to the production of neutrons and gamma rays, which leave the calorimeter. These events are expected to contribute to the low-energy tail visible in the calorimeter spectrum (see Fig. 5), but will also broaden the main peak to some degree. For larger WEPL values, the uncertainty of the calorimeter response increases due to increasing energy straggling in the degrader, but this is compensated by the increasing sensitivity of the energy deposited in the calorimeter to changes in WEPL, thus leading to an overall decrease in WEPL uncertainty. One should also note that by recording a larger number of proton events, very precise RSP determinations of any material can be performed.
WET comparison
Table TABLE I. compares the WET values obtained with the pCT measurement and the standard water-tank measurement. Both methods agreed to better than ±0.5. Note that the RSP uncertainty was smaller for the results obtained with the pCT scanner, while the dose to the phantom was significantly lower, by a factor of approximately 105.
TABLE I.
Comparison of RSP measurements obtained using the pCT scanner and using a water phantom depth-dose range shift measurement.
| Range shift | pCT | |||
|---|---|---|---|---|
| Material | RSP | RSP | ||
| Lung | 0.267 | 0.005 | 0.268 | 0.001 |
| Adipose | 0.947 | 0.007 | 0.943 | 0.002 |
| Muscle | 1.032 | 0.008 | 1.037 | 0.002 |
| Brain | 1.062 | 0.007 | 1.064 | 0.002 |
| Liver | 1.076 | 0.005 | 1.078 | 0.002 |
| Cortical bone | 1.599 | 0.007 | 1.595 | 0.002 |
pCT scan of a water phantom
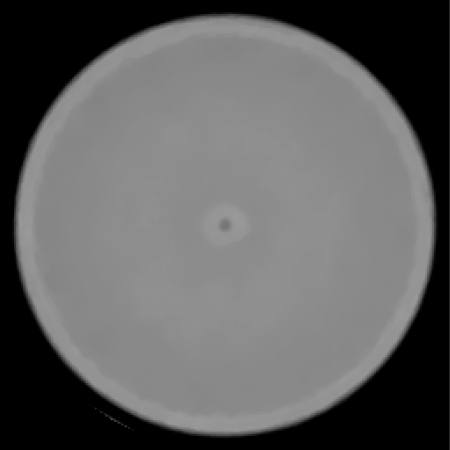
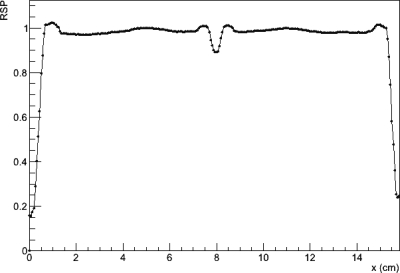
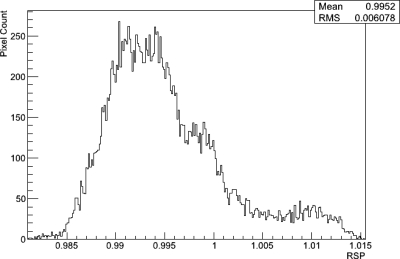
Figure 10 shows an axial slice from the reconstruction of the water phantom. A close inspection shows that there are systematic ring artifacts in the reconstruction. The central artifact is related to the overlap region of the tracker planes mentioned above. It was attempted to predict the protons which passed through an additional two silicon planes and to subtract the water-equivalent of the additional 0.8 mm of silicon. Obviously, this correction leads to a partial underestimation and a partial overestimation of the true phantom stopping power in the central region. The underestimation is probably due to the histories that did not pass through all the tracker planes as assumed and the overestimation due to the histories that were assume to miss the overlap but, in fact, did not. The outer ring artifacts are most likely due to incomplete compensation of the variations in the signal from individual calorimeter crystals. Figure 11 shows a central band profile across an axial slice. Again the central artifact as well as the ring artifacts is seen. Excluding the central artifact, reconstructed RSP values for the water phantom agreed with the expected value of 1 to within about . Figure 12 shows a histogram of RSP values selected from a region of interest excluding the central artifact and acrylic walls. The mean RSP value is 0.995 with an RMS variation of 0.006.
Figure 10.
Axial reconstructed slice of the water phantom scanned with the pCT scanner prototype. The WEPL values for the reconstruction were derived using the calibration procedure described in this paper.
Figure 11.
Profile across the central band of the axial slice of the water phantom shown in Fig. 10. A central dip artifact can be seen at x = 8 cm and a larger ring artifact between 5 and 11 cm is noticeable. The 0.5 cm thick acrylic walls are seen as a slight rise at the edges of the profile.
Figure 12.
Histogram of RSP values for the water phantom excluding the central artifact and acrylic walls.
DISCUSSION
The concept of water-equivalent density, range, and thickness is fundamental to dosimetry and treatment planning of proton therapy. ICRU Report 78 (Ref. 30) defines water-equivalent density of a material sample of thickness as the density of a material of atomic composition of water and identical thickness that leads to the same energy loss as the material sample. From this definition and the fact that stopping power is linearly related to material density, it is obvious that the water-equivalent density equals the density of water times the RSP of the material with respect to water. It follows that a detailed RSP map of the object provides the information required for dose and range calculations in proton beams. In current practice, water-equivalent density is derived by conversion of the Hounsfield values of an x-ray CT scan, which leads to average systematic range uncertainties of the order of 3%–4% in relatively uniform tissues, and possibly higher uncertainties in the presence of larger heterogeneities. Proton CT has the potential to reduce the uncertainty related to conversion of Hounsfield values by measuring the residual energy (or a quantity that is related to it) and converting it to WEPL of protons traversing a heterogeneous sample using an adequate calibration of the detector response against WET of known materials. The pCT scanner can then be used to reconstruct RSP by acquiring many proton histories from multiple directions. It can also be used to accurately measure the WET of materials of not exactly known composition that may be present in the beam path during treatment.
We have developed and applied a method for calibrating the response of the pCT scanner against the WET of accurately machined polystyrene degrader plates. Schneider and Renker26 described a procedure to calibrate a NaI(Tl) scintillator used for proton radiography measurements. The authors noted that if the initial energy at the entry of their setup had been known, the procedure of calibrating the (nonlinear) light output variation with incoming energy would be simple. Since the protons pass various foils and detectors, which are not accurately known, the exact energy at the level of the scintillator is also not accurately known. To solve this problem, these authors determined the initial energy by fitting an analytical model describing the light output.
When we set out to calibrate our pCT energy detector, we similarly recognized that due to uncertainty in the amount of energy lost in the material between the accelerator and the calorimeter, the energy of protons reaching the calorimeter crystal matrix has both systematic and random uncertainties. On the contrary, the WET of the degrader blocks is relatively accurate since these blocks, which are also used for clinical proton dose calibrations, are uniform and have an accurately known density and an RSP determined by measurement. Thus, the uncertainty of the WET value of individual degrader plates can be assumed to be much less than 1%. The main uncertainty in our calibration measurements is the statistical variation of the calorimeter response due to energy straggling and limited resolution of the calorimeter due to variations in the light collection. These uncertainties, which are proportional to , can be minimized by increasing the number, N, of proton histories. A second disadvantage of using a residual energy measurement and converting it to WEPL analytically is that the conversion of energy loss to WEPL is limited by the accuracy of the theoretical relationship between these quantities, i.e., the Bethe–Bloch equation and its parameters. Unfortunately, the value of the mean excitation energy for liquid water is particularly uncertain. For example, the NIST PSTAR data base31 recommends a value of 75 eV, whereas the Particle Data Group32 suggests a value of 79.7 eV. Therefore, as recently pointed out by Gottschalk,33 an experimental measurement of WET and RSP, conducted by finding the thickness of a degrader that leads to the same energy loss as a known layer of water, should currently be preferred to theoretical RSP calculations based on the Bethe–Bloch equation.
The calibration method presented in this work was tested by measuring the RSP values of different tissue-equivalent material plates and comparing them to those derived from measuring the range shift introduced by the material in a water-tank, which can be considered the standard method of WET measurements. When using our method as a RSP measurement technique, distinct advantages of the current calibration method were noted. First, the pCT scanner measurement is much faster than the water-tank based method. It only takes a few seconds to collect the proton histories required for an accurate RSP measurement, while the water-tank measurements requires about 15 min per WET determination for 10–15 individual measurements along the distal fall-off of the original and shifted SOBP.
The practical usefulness of the calibration method for reconstructing the RSP values of an object was also tested by scanning a cylindrical water phantom with our pCT scanner. The mean reconstructed RSP value was found to be within 0.5% of the true value of 1, which shows that our method leads to accurate reconstruction of RSP values, at least for tissue that are nearly water-equivalent. Some systematic artifacts leading to deviations from the true value can be explained by the incomplete correction for the partial overlap of silicon tracker planes in the central 5 mm region of the pCT trackers and by a residual inaccuracy of the relative weighting factors of individual crystals. These systematic errors can, in principle still be corrected. It is planned to address the overlap issue of tracker planes in the next generation of pCT scanner using edge-less sensors.
CONCLUSIONS
A pCT scanner calibration method based on degraders of known water-equivalent thickness should be preferred to energy calibration and theoretical calculation of the water-equivalent path length. The calibration method presented here provides a straightforward way to acquire consistent and reliable water-equivalent thickness measurements and the means to reconstruct relative stopping power distributions with good accuracy.
ACKNOWLEDGMENTS
The authors would like to acknowledge Robert Jones for engineering support, Birgit Schulte and Mary Hurley for editorial assistance, and Jeff Hubbard and Michael Moyers for useful discussions. This work was supported in part by Grant No. 1R01EB013118-01 from the National Institutes of Health, DOD Contract No. W81XWH0–08–1–0205, and the Loma Linda University Medical Center, Department of Radiation Medicine.
References
- Cormack A. M., “Representation of a function by its line integrals, with some radiological applications,” J. Appl. Phys. 34, 2722–2727 (1963). 10.1063/1.1729798 [DOI] [Google Scholar]
- Cormack A. M. and Koehler A. M., “Quantitative proton tomography: Preliminary Experiments,” Phys. Med. Biol. 4, 560–569 (1976). 10.1088/0031-9155/21/4/007 [DOI] [PubMed] [Google Scholar]
- Hanson K. M., “Proton computed tomography,” IEEE Trans. Nucl. Sci. 26, 1635–1640 (1979). 10.1109/TNS.1979.4330455 [DOI] [Google Scholar]
- Hanson K. M., Bradbury J. N., Cannon I. M., Hutson R. L., Laubacher D. B., Macek R. J., Paciotti M. A., and Taylor C. A., “Computed tomography using proton energy loss,” Phys. Med. Biol. 26, 965–983 (1981). 10.1088/0031-9155/26/6/001 [DOI] [PubMed] [Google Scholar]
- Zygmanski P., Gall K. P., Rabin M. S. Z., and Rosenthal S. J., “The measurement of proton stopping power using proton-cone-beam computed tomography,” Phys. Med. Biol. 45, 511–528 (2000). 10.1088/0031-9155/45/2/317 [DOI] [PubMed] [Google Scholar]
- Sadrozinski H. F.-W., Bashkirov V., Bruzzi M., Johnson L. R., Keeney B., Ross G., Schulte R. W., Seiden A., Shahnazi K., Williams D. C., and Zhang L., “Issues in proton computed tomography,” Nucl. Instrum. Methods A 511, 275–281 (2003). 10.1016/S0168-9002(03)01806-0 [DOI] [Google Scholar]
- Sadrozinski H. F.-W., Bashkirov V., Keeney B., Johnson L. R., Peggs S. G., Ross G., Satogata T., Schulte R. W. M., Seiden A., Shanazi K., and Williams D. C., “Toward proton computed tomography,” IEEE Trans. Nucl. Sci. 51, 3–9 (2004). 10.1109/TNS.2003.823044 [DOI] [Google Scholar]
- Schulte R. W., Bashkirov V., Li T., Liang Z., Mueller K., Heimann J., Johnson L. R., Keeney B., Sadrozinski H. F.-W., Seiden A., Williams D. C., Zhang L., Li Z., Peggs S., Satogata T., and Woody C., “Conceptual design of a proton computed tomography system for applications in proton radiation therapy,” IEEE Trans. Nucl. Sci. 51, 866–872 (2004). 10.1109/TNS.2004.829392 [DOI] [Google Scholar]
- Johnson L. R. et al. , “Initial studies on proton computed tomography using a silicon strip detector telescope,” Nucl. Instrum. Methods A 514, 215–223 (2003). 10.1016/j.nima.2003.08.108 [DOI] [Google Scholar]
- Bashkirov V. A., Schulte R. W., Penfold S. N., and Rosenfeld A. B., “Proton computed tomography: Update on current status,” 2007 IEEE Nuclear Science Symposium Conference Record (Honolulu, Hawaii, 2007), Vol. 6, pp. 4685–4688.
- Bruzzi M. et al. , “Prototype tracking studies for proton CT,” IEEE Trans. Nucl. Sci. 54, 140–145 (2007). 10.1109/TNS.2006.889642 [DOI] [Google Scholar]
- Missaghian J., Hurley R. F., Bashkirov V., Colby B., Rykalin V., Kachigiun S., Fusi D., Schulte R., Mckinney F. M., Sadrozinski H., and Penfold S., “Beam test results of a CsI calorimeter matrix element,” J. Instrum 5, 6001 (2010). 10.1088/1748-0221/5/06/P06001 [DOI] [Google Scholar]
- Penfold S. N., Rosenfeld A. B., Schulte R. W., and Sadrozinksi H.-F. W., “Geometrical optimization of a particle tracking system for proton computed tomography,” Radiat. Meas. 46, 2069–2072 (2011). 10.1016/j.radmeas.2011.04.032 [DOI] [Google Scholar]
- Li T., Liang Z., Singanallur J. V., Satogata T. J., Williams D. C., and Schulte R. W., “Reconstruction for proton computed tomography by tracing proton trajectories, A Monte Carlo study,” Med. Phys. 33, 699–706 (2006). 10.1118/1.2171507 [DOI] [PMC free article] [PubMed] [Google Scholar]
- Schulte R. W., Penfold S. N., Tafas J. T., and Schubert K. E., “A maximum probability proton path formalism for application in proton computed tomography,” Med. Phys. 35, 4849–4856 (2008). 10.1118/1.2986139 [DOI] [PubMed] [Google Scholar]
- Penfold S. N., Rosenfeld A. B., Schulte R. W., and Schubert K. E., “A more accurate reconstruction system matrix for quantitative proton computed tomography,” Med. Phys. 36, 4511–4518 (2009). 10.1118/1.3218759 [DOI] [PubMed] [Google Scholar]
- Penfold S. N., Schulte R. W., Censor Y., and Rosenfeld A. B., “Total variation superiorization schemes in proton computed tomography image reconstruction,” Med. Phys. 37, 5887–5895 (2010). 10.1118/1.3504603 [DOI] [PMC free article] [PubMed] [Google Scholar]
- Penfold S. N., “Image reconstruction and Monte Carlo simulations in the development of proton computed tomography for applications in proton radiation therapy,” Ph.D. thesis, University of Wollongong, 2010). [Google Scholar]
- Schneider U. and Pedroni E., “Proton radiography as a tool for quality control in proton therapy,” Med. Phys. 22, 353–363 (1995). 10.1118/1.597470 [DOI] [PubMed] [Google Scholar]
- Han B B., Xu X. G., and Chen G. T., “Proton radiography and fluoroscopy of lung tumors: A Monte Carlo study using patient-specific 4DCT phantoms,” Med. Phys. 38, 1903–1911 (2011). 10.1118/1.3555039 [DOI] [PMC free article] [PubMed] [Google Scholar]
- Pemler P., Besserer J., De Boer J., Dellert M., Gahn C., Moosburger M., Schneider U., Pedroni E., and Stäuble H., “A detector system for proton radiography on the gantry of the Paul Scherrer Institute,” Nucl. Instrum. Methods A 432, 483–495 (1999). 10.1016/S0168-9002(99)00284-3 [DOI] [Google Scholar]
- Schneider U., Besserer J., Pemler P., Dellert M., Moosburger M., Pedroni E., and Kaser-Hotz B., “First proton radiography of an animal patient,” Med. Phys. 31, 1046–1051 (2004). 10.1118/1.1690713 [DOI] [PubMed] [Google Scholar]
- Ryu H., Song E., Lee J., and Kim J., “Density and spatial resolutions of proton radiography using a range modulation technique,” Phys. Med. Biol. 53, 5461–5468 (2008). 10.1088/0031-9155/53/19/012 [DOI] [PubMed] [Google Scholar]
- Sipala V., Bruzzi M., Bucciolini M., Candiano G., Capineri L., Cirrone G. A. P., Civinini C., Cuttone G., Lo Presti D., Marrazzo L., Mazzaglia E., Menichelli D., Randazzo N., Talamonti C., and Valentini S., “A proton imaging device: Design and status of realization,” Nucl. Instrum. Methods A 612, 566–570 (2010). 10.1016/j.nima.2009.08.029 [DOI] [Google Scholar]
- Seco J. and Depauw N., “Proof of principle study of the use of a CMOS active pixel sensor for proton radiography,” Med. Phys. 38, 622–623 (2011). 10.1118/1.3496327 [DOI] [PubMed] [Google Scholar]
- Schneider U. and Renker D., “Proton energy measurements using a NaI(T1) scintillator,” Nucl. Instrum. Methods A 388, 199–203 (1997). 10.1016/S0168-9002(97)00349-5 [DOI] [Google Scholar]
- Romero J. L., Needham G. A., Brady F. P., Castaneda C. M., and Ford T. D., The response of NaI(T1) to 30-60 MeV Z = 1 particles, Nucl. Instrum. Methods A 301, 241–245 (1991). 10.1016/0168-9002(91)90465-3 [DOI] [Google Scholar]
- Herman G. T., Fundamentals of Computerized Tomography: Image Reconstruction from Projections, 2nd ed. (Springer, New York, 2009). [Google Scholar]
- Coutrakon G., Hubbard J., Koss P., Sanders E., and Panchal M., “Beam Optics for a Scanned Proton Beam at Loma Linda University Medical Center,” Proceedings of the 17th International Conference on the Application of Accelerators in Research and Industry, American Institute of Physics (Denton, Texas, 2003), Vol. 680, pp. 1116–1120.
- International Commission on Radiation Units and Measurements (ICRU), “Prescribing, recording, and reporting proton beam therapy,” ICRU Report No. 78 (Journal of ICRU, 2007).
- NIST, National Institute of Standards and Technology PSTAR Database Program, http://physics.nist.gov/PhysRefData/Star/Text/PSTAR.html.
- PDG, Particle Data Group, Atomic and Nuclear Properties of Materials for more than 300 materials, Page maintained by Don Groom, http://hepdata.cedar.ac.uk/lbl/2011/AtomicNuclearProperties/index.html.
- Gottschalk B., “Comments on ‘Calculation of water equivalent thickness of materials of arbitrary density, elemental composition, and thickness in proton beam irradiation,’” Phys. Med. Biol. 55, 129–130 (2010). 10.1088/0031-9155/55/9/L01 [DOI] [PubMed] [Google Scholar]


