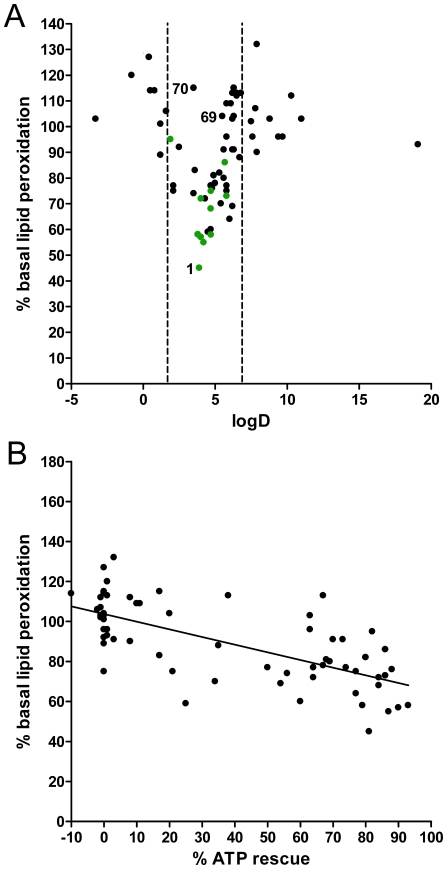
Figure 4. Effect of quinones on basal lipid peroxidation is dependent on their logD value.
(A) Cellular levels of basal lipid peroxidation were measured using BODIPY-C11 dye and correlated with the respective logD value. Response to DMSO was set to 100%. Compounds #69 and 70 represent two mitochondrially targeted idebenone molecules. The values are means ± SD, n = 3 replicate wells. (B) Lipid peroxidation values were correlated to ATP rescue efficiency of each quinone. Data represent values for L6 cells. Similar results were obtained for human immortalized hepatic cells (HepG2) and human myoblasts (9Te) (Figure S3). For reasons of clarity, the highly prooxidative (>200%) compounds (# 36,44,52,63 64) and error bars were omitted from graphs but standard deviation values can be found in Supplementary Table S2, which lists all results.

