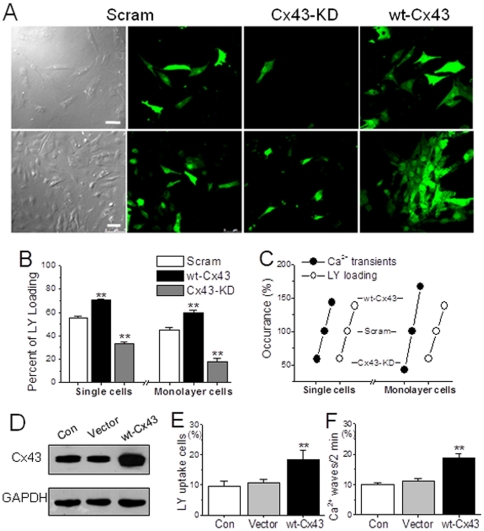
Figure 4. Role of Cx43 in LY uptake in NRVMs.
(A, B) Typical confocal images of LY uptake in single and confluent NRVMs with Cx43 overexpression or silence by adenovirus infection (m.o.i. = 15). The LY uptake cells in each group as indicated were counted and expressed with percentage of the total recorded cells determined by 5–6 independent experiments for each bar. ** represents P<0.01 vs. scramble (Scram) cells. (C) Corresponding alterations of global Ca2+ transients and LY uptake in response to manipulations of Cx43 in both single and confluent monolayer NRVMs. (D) HEK293 cells were transfected with vector or plasmids carrying Cx43 for 48 h and determined their levels of Cx43 expression by Western blot. (E, F) Statistical data of the LY uptake percentage and Ca2+ wave frequency from different groups of HEK293 cells as indicated were obtained from 5–6 independent experiments. ** denotes P<0.01 vs. vector in all panels.

