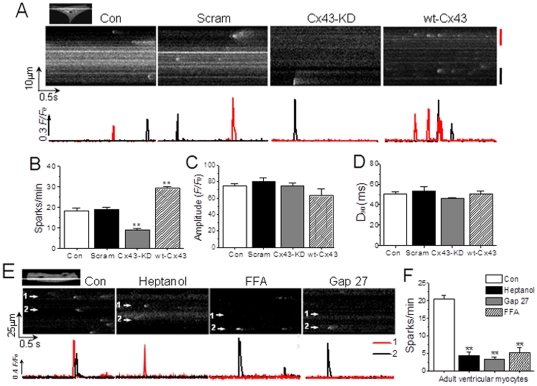
Figure 5. Effect of gap inhibition on Ca2+ sparks in NRVMs and adult mouse cardiomyocytes.
(A) Typical linescan images of Ca2+ sparks (upper panel) and their F/F0 changes over the time (lower panel) in single NRVM from different groups as indicated. (B, C, D) Statistical data of the spark frequency, amplitude and duration in NRVMs in different groups as indicated were obtained from 4–5 independent determinations, n = 20–36 cells for each panel. ** represents P<0.01 vs. scramble. (E) Typical linescan images of Ca2+ sparks (upper panel) and their F/F0 changes over the time (lower panel) in adult mouse ventricular myocytes. The cells were respectively treated with vehicle (Con), 1.5 mM heptanol for 2 min, 300 µM Gap 27 for 30 min or 25 µM FFA for 5 min. (F) Statistical data from 3–5 independent determinations (n = 15–20 cells for each bar) show the effect of the drugs on the Ca2+ spark rate. ** represents P<0.01 vs. control.

