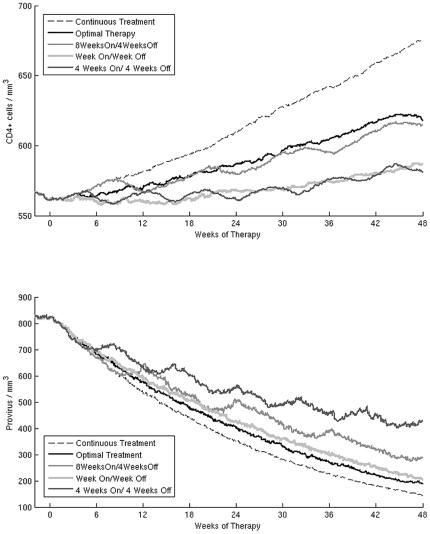
Figure 6. Simulation results.
Median CD4+ cells count (upper panel) and provirus levels (lower panel) of the 250 virtual patients during the 48 weeks treatment period. In each panel we show the different STI tested in this study, the optimal therapy and the continuous therapy. The levels of provirus seem to be responsible for the failure of STI treatment as much as the CD4+ cells count. The “4 Weeks On/4 Weeks Off" schedule has the worst survival curve because of the high level of provirus even though it has a CD4+ cells count comparable to that of the “Week On/Week Off" STI.

