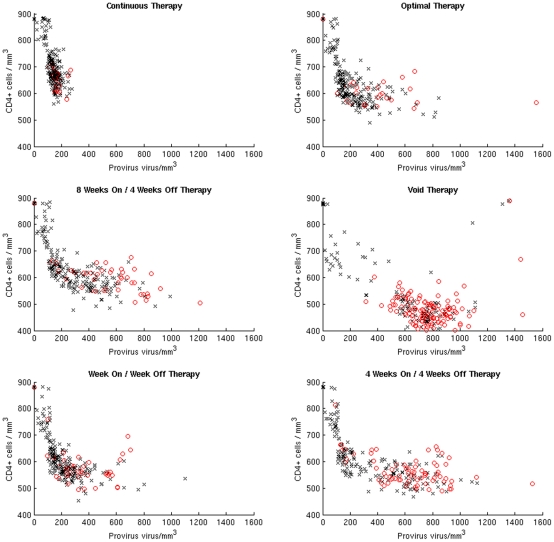
Figure 7. Survivors and Casualties.
In each panel we show the CD4+ cell counts versus provirus of the 250 virtual patients at the end of the treatment period. The black markers indicate the patients that survived the opportunistic bacterial infection, whereas the red markers indicate the patients that died within 30 days of the bacterial infection.

