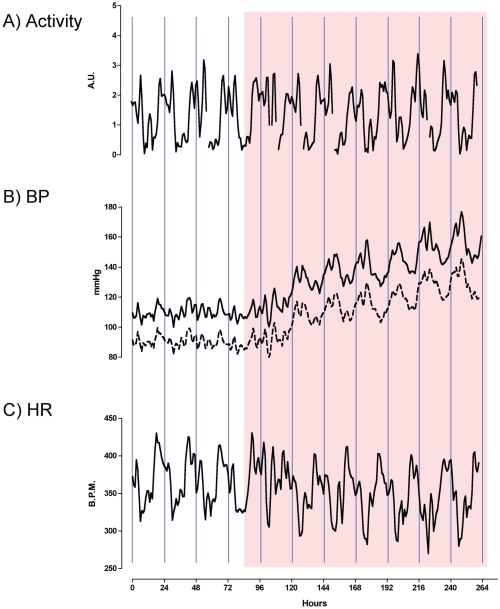
Figure 1. Telemetry data from Cyp1a1-Ren2 transgenic rats.
Recordings were made in rats (n = 5) over a baseline period and following 7 consecutive days of indole-3-carbinol administration (I3C; Shaded area). A) locomotor activity; B) Blood pressure (BP), with systolic as a solid line and diastolic as a dashed line and C) HR. Data are hourly means, smoothed with a 5-point rolling average and shown without error bars for clarity. The vertical lines represent the midnight time point. I3C was administered at 10am.

