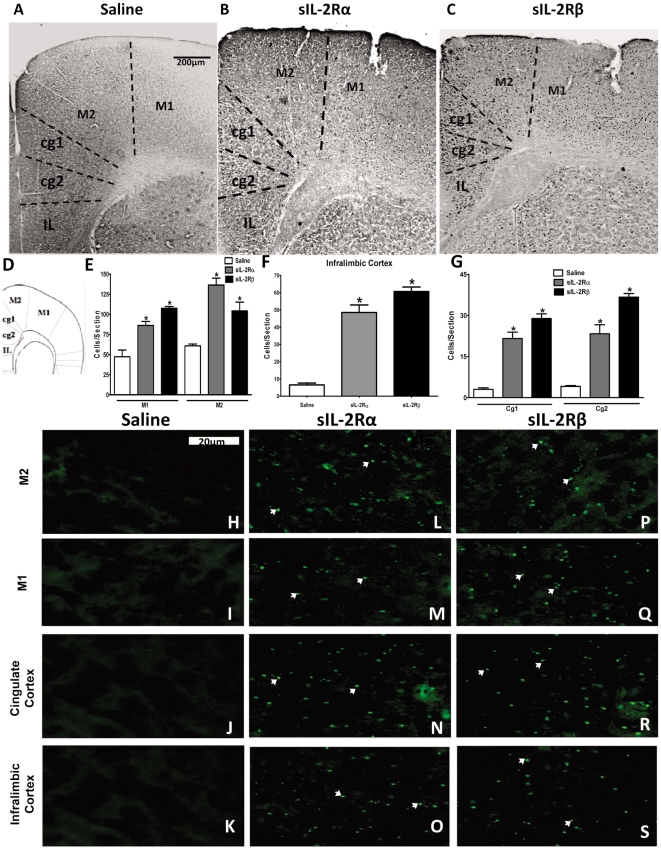
Figure 5. c-Fos expression and Fluorescent staining of Cortices in sIL-2Rs treated mice.
Photomicrographs of brain sections showing Fos-like immunoreactive cells in the motor cortex, cingulate cortex and infralimbic cortex of mice receiving single injection of (A) saline, (B) 1 µg sIL-2Rα or (C) 2 µg sIL-2Rβ. (D) Insert reflects regions sampled for counting Fos-positive cells in the motor cortex, cingulate cortex and infralimbic cortex. Histogram shows the number (mean ± S.E.M.) of Fos-positive cells counted within the indicated compartments of the (E) motor cortex, (F) cingulate cortex and (G) infralimbic cortex after administration of saline or single injections of sIL-2Rα or sIL-2Rβ. Photomicrographs of deposits of sIL-2Rα or sIL-2Rβ in (H, L and P) M1 division of motor cortex, (I, M and Q) M2 division of motor cortex, (J, N and R) cingulate cortex, and (K, O and S) infralimbic cortex.

