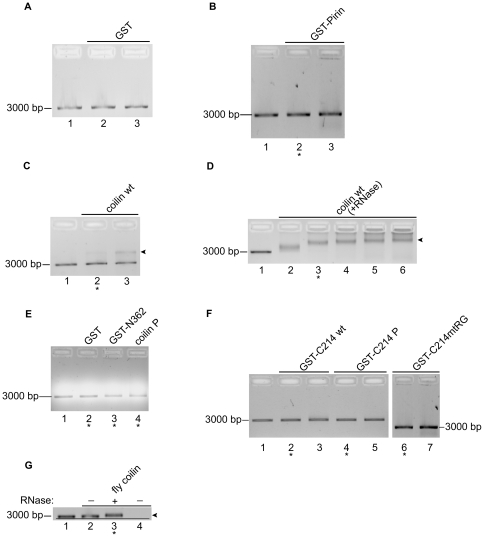
Figure 4. Purified coilin binds DNA.
All reactions contain purified electro-eluted protein and 13 ng DNA. After incubation, reactions were loaded into 1% agarose gels containing ethidium bromide. The location of the approximately 3000 bp unbound DNA is indicated. Lane 1 for each gel represents control reactions without protein. A, negative control GST; Lane 2, 0.22 µg; Lane 3, 2.2 µg. B, negative control GST-pirin; Lane 2, 0.2 µg; Lane 3, 2 µg. C, coilin wt; Lane 2, 0.13 µg; Lane 3, 0.5 µg. D, RNase treated coilin wt; Lanes 2–6, 0.1, 0.2, 0.4, 0.6, 0.8 µg. E, negative control GST, 0.29 µg; coilin construct GST-N362, 0.29 µg; coilin P construct, 0.29 µg. F, GST-C214, GST-C214 P and GST-C214mtRG; Lanes 2–3, 0.29 and 0.57 µg; Lanes 4–5, 0.29 and 0.57 µg; Lanes 6–7, 0.2 and 2 µg. G, D. melanogaster coilin either untreated or pre-treated with RNase A/T1; Lane 2, 0.19 µg untreated protein; Lane 3, 0.19 µg RNase treated; Lane 4, 0.19 untreated protein alone; line is drawn to highlight the slight DNA mobility shift. Arrows in C, D, and G indicate the location of a distinct protein/DNA complex, resulting in slower migration than unbound DNA. Asterisk (*) under lanes denotes protein amount included in Table 1 for DNA binding.

