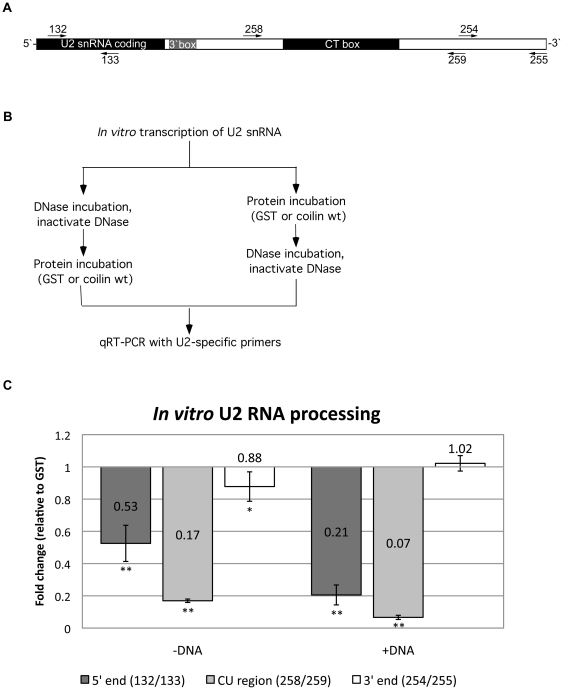
Figure 5. Purified coilin cleaves U2 RNA transcript.
A, Diagram of U2 gene repeat region including snRNA coding region and extending ∼630 bp beyond. Primers used for qRT-PCR are denoted; forward primers above and reverse primers below diagram. B, Diagram of protocol for incubations and subsequent analysis of U2 RNA via qRT-PCR. C, graph of relative U2 RNA qRT-PCR product amount following incubation with purified electro-eluted coilin. Values represent fold change of product levels following coilin incubation, normalized to GST incubation set at 1. Error bars represent 1 standard deviation of fold change, n = 9. Statistical analysis performed using a paired Student's Ttest of GST incubated and coilin incubated Ct values. * denotes p<0.03, ** denotes p<0.0005.

