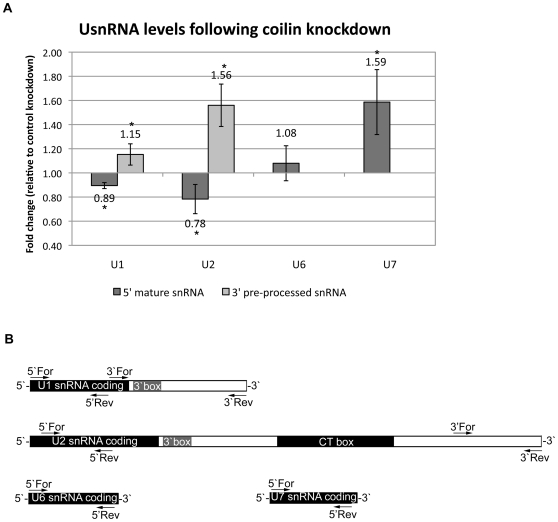
Figure 6. Coilin knockdown results in accumulation of primary U snRNA transcripts.
A, relative U snRNA levels in HeLa cells following coilin knockdown. Error bars represent 1 standard deviation of fold change, n = 9. Statistical analysis performed using a paired Student's Ttest of the change in Ct relative to GAPDH between control and coilin knockdown RNA. * denotes p<0.04. C, diagrams of U snRNA genes with locations of primers used for qRT-PCR analysis noted.

