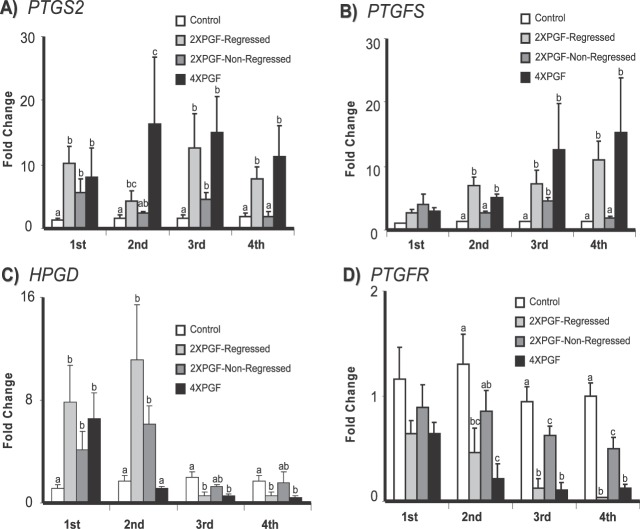
FIG. 4.
Effect of intrauterine PGF or PBS treatment on steady-state mRNA concentrations for A) PTGS2 (prostaglandin-endoperoxide synthase 2), B) PTGFS (prostaglandin F synthase), C) HPGD (hydroxyprostaglandin dehydrogenase 15-[NAD]), and D) PTGFR (prostaglandin F receptor). Data are shown as fold changes ± SEM. Columns with different letters (a, b, c) at each biopsy indicate differences, P < 0.05. First, second, third, and fourth indicate biopsy times.

