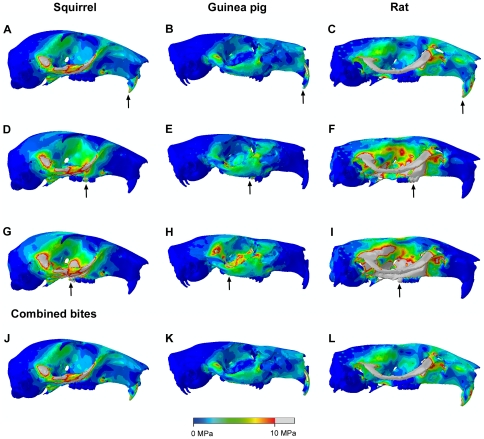
Figure 3. Predicted distribution of von Mises stresses across the skull.
Arrows indicate the biting tooth: (A–C) incisor bites; (D–F) unilateral bites on M1; (G–I) unilateral bites on M3; (J–L) maximum von Mises stress experienced by each element across unilateral and bilateral bites on every tooth. (A,D,G,J) squirrel; (B,E,H,K) guinea pig; and (C,F,I,L) rat. Grey areas indicate von Mises stresses exceeding 10 MPa.

