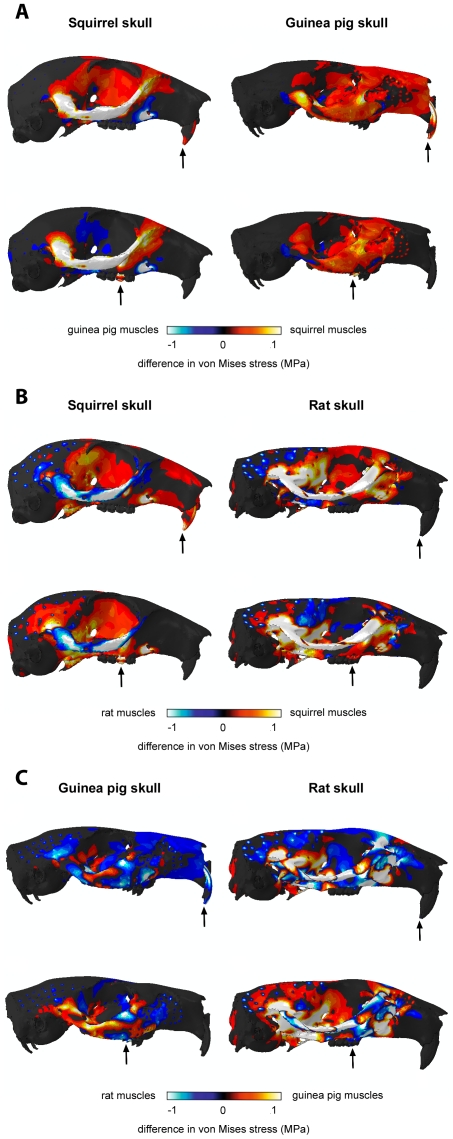
Figure 7. Contour maps showing the difference in von Mises stresses experienced by each model when loaded with different muscle configurations.
(A) Stress generated by guinea pig muscles subtracted from stress generated by squirrel muscles. (B) Stress generated by rat muscles subtracted from stress generated by squirrel muscles. (C) Stress generated by rat muscles subtracted from stress generated by guinea pig muscles. Positive results represented by hot colours, negative results by cool colours. Dotted pattern in temporal region of the rat (B and C) indicates the nodes from which the temporalis muscle originates and is a result of the large temporalis of the rat. Arrows indicate the biting tooth.

