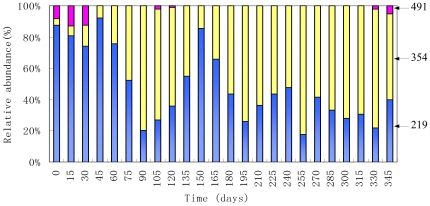
Figure 2. Histograms of T-RF relative abundances in the system for TaqI T-RFLP profiles.
The relative abundance is the ratio of the peak area of a given T-RF in a given sample to the sum of all T-RFs in that sample expressed as a percentage. Arrows indicate the sizes of the restriction fragments for the abundant T-RFs in base pairs.

