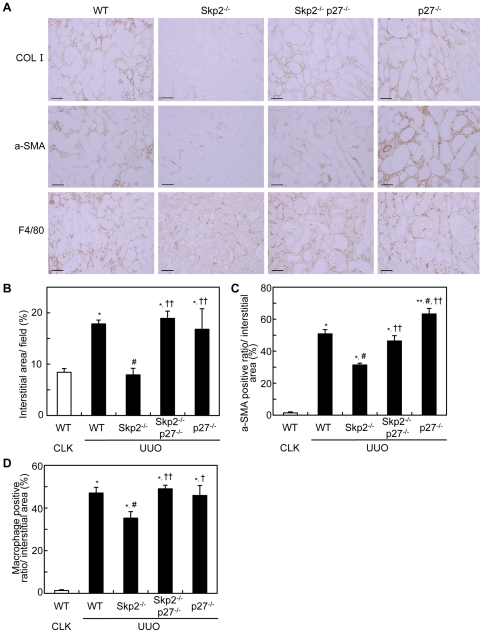
Figure 5. Levels of tubulointerstitial fibrotic lesions.
(A) Representative images of UUO kidney sections in WT, Skp2−/−, Skp2−/−p27−/− and p27−/− mice immunostained for type I collagen (top panels), α-SMA (middle panels) and F4/80 (bottom panels) at 7 days after UUO, scale bars: 50 µm. (B) The ratios of the interstitial area in the UUO kidneys were quantified using the sections stained for type I collagen. (C, D) The intensities of the α-SMA (C) and F4/80 (D) immunostaining were quantified using Scion Image software. The CLK kidneys in WT mice were evaluated as controls. *P<0.01 versus WT CLK kidneys, # P<0.01 versus WT UUO kidneys and † P<0.05, †† P<0.01 versus Skp2−/− UUO kidneys.

