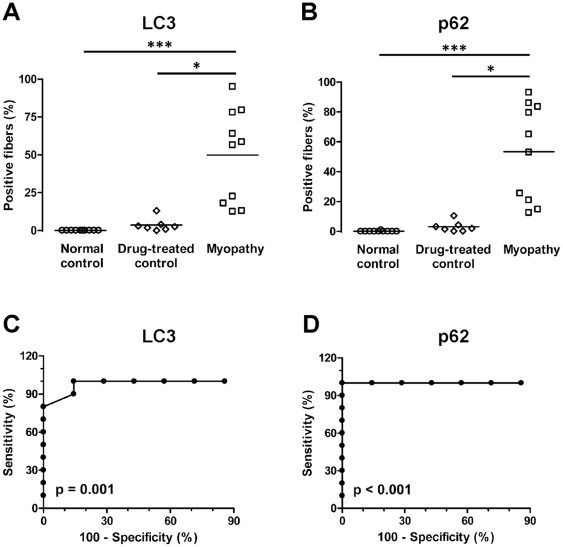
Figure 3. Quantification of LC3- and p62-positive fibers in FFPE material.
A and B. The percentage of LC3- (A) and p62-positive (B) fibers was significantly higher in autophagic myopathy group (squares) than in either normal control (circles) or drug-treated control group (diamonds). Each study subject is represented with a symbol; the lines indicate group means. ***, p<0.001; *, p<0.05. C and D. ROC analysis indicates that quantitative immunohistochemistry for either LC3 (C) or p62 (D) can successfully differentiate autophagic myopathy from control cases among drug-treated subjects.

