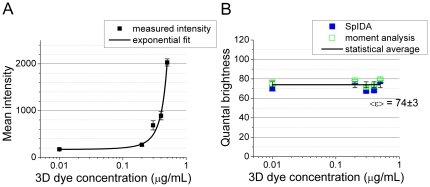
Figure 3. Quantal brightness of Alexa Fluor 488 measured for 2D samples prepared with different values of concentration in 3D solution.
(A) Mean intensity measured from ROIs. (B) The values of the quantal brightness measured with fluorescent image moment analysis and SpIDA as a function of the dye concentration in solution. The error bars were calculated as the standard error of multiple images taken at different locations in the sample.

