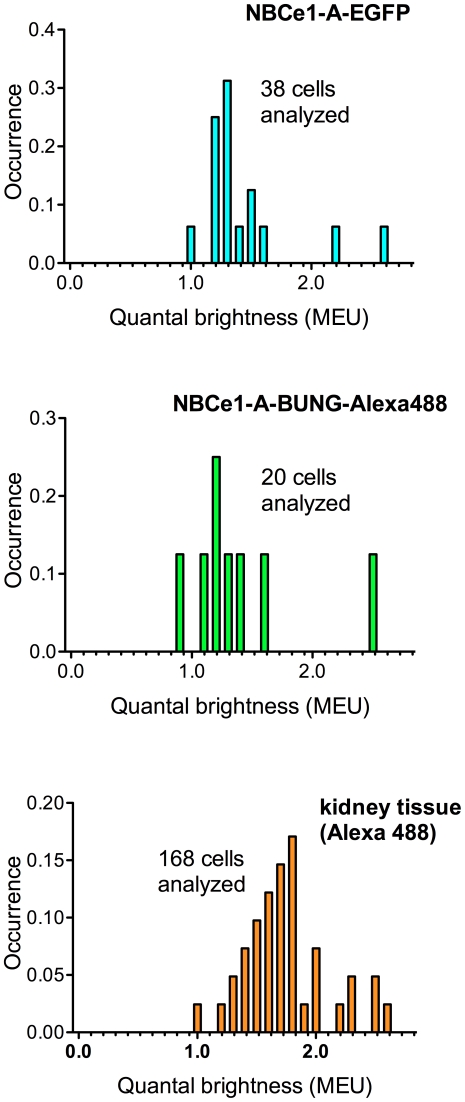
Figure 5. Spatial fluorescence intensity moment analysis of the NBCe1-A oligomerization states.
The percent occurrence graphs (A–C) show the recovered values of quantal brightness normalized to MEU. The experiments were carried out on fixed cells. All of the measurements summarized in each histogram were carried under identical collection conditions.

