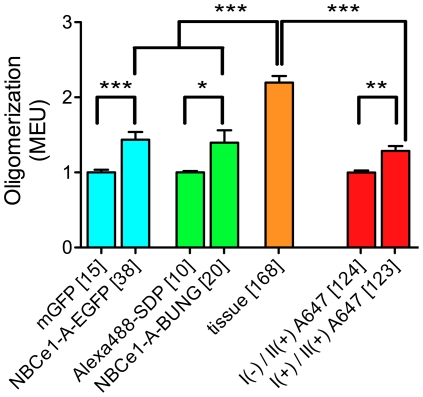
Figure 6. Spatial fluorescence intensity moment analysis of NBCe1-A oligomerization state in expression systems and native tissues.
The cotransporter is predominantly a monomer when it is expressed heterologously in CHO-K1 cells, and is a dimer or rarely higher order oligomer in rat kidney tissue. The error bars represent the standard error of the means obtained from multiple cells. Numbers in square brackets represent n cells. Nonparametric t-tests were performed on the selected data sets (*** = p<0.001, ** = p<0.01, * = p<0.05). All of the measurements were carried out under identical collection conditions.

