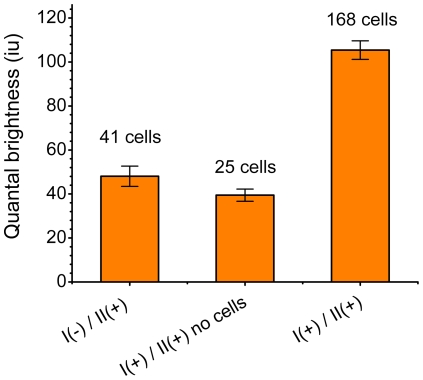
Figure 8. The fluorescence image moment analysis of the oligomerization state of the native NBCe1-A in rat kidney tissues.
CLSM images of the native NBCe1-A immunostained with primary anti-wt-NBCe1-A antibody (I) and the secondary Alexa Fluor 488 conjugated antibody (II) were analyzed (the right bar). For establishing the monomeric label control, images of tissues immunostained with the secondary antibody in the absence of the primary were analyzed (the bar on the left). As an extra control, regions in between neighboring kidney cells (empty regions) in CLSM images of kidney tissues labeled with both anti-wt-NBCe1-A primary antibody and the fluorescently labeled (Alexa Fluor 488) secondary antibody were analyzed (the middle bar). The moment analysis reveals non-significant binding of both primary and secondary antibody together. The error bars represent the standard error of the mean obtained from multiple cells.

