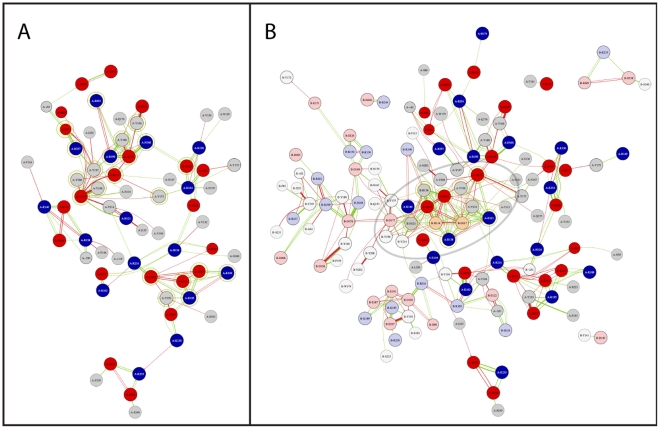
Figure 2. Electrostatic interaction node maps and position of H121-Y214 hydrogen bond.
Electrostatic interaction node maps generated from the results of the multi conformer continuum electrostatic calculations for A) the VDEpH7 and B) the VDEpH5. Acids and bases are shown as red and blue, respectively. The width of the edge is scaled according to the strength of the interaction. Green and red edges indicate stabilizing or de-stabilizing interactions, respectively. Electrostatic interaction node maps of the VDEpH5 show residues of chain B opaque. A contact map of the two subunits is shown in Figure S2. Interaction are only shown if the absolute electrostatic interaction is greater than 0.4 kcal mol−1. The graph densities are 0.059 and 0.029, for VDEpH7 (A) and VDEpH5 (B) node maps, respectively. Interaction cutoff is 0.2 kcal mol−1. Major interaction hubs, representing k-cores of 4 or 7 and 6 in the VDEpH7 (A) or VDEpH5 (B) form, respectively, are highlighted with yellow circles.

