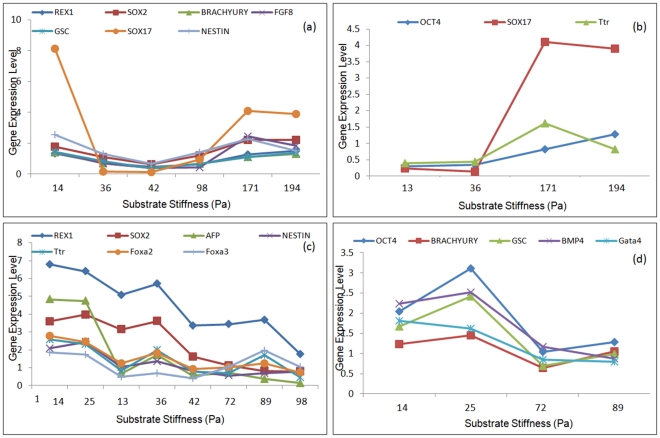
Figure 6. Optimal bi-clusters identified at mean value of experimental dataset.
Solving equation (5) at mean value of the experimental data identifies the optimal bi-clusters for 2-dimensional culture (a, b) and 3 dimensional culture (c, d). The bi-clustering algorithm was solved sequentially by penalizing the previously identified bi-cluster in subsequent runs to avoid significant overlap. Single overlap was identified in the 2D dataset (Sox17) while no overlap was identified in the 3D dataset.

