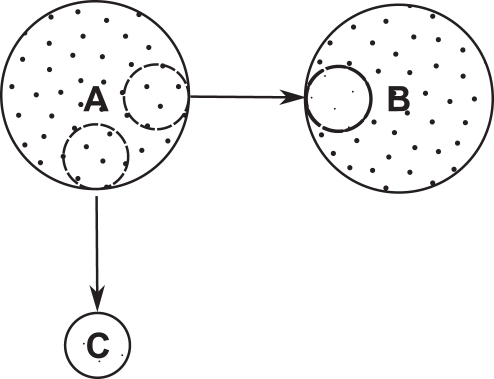
Figure 1. A model of change in phonemic diversity through drift and recovery.
At time  two small populations, B and C, emigrate from population
  and colonize two different regions. Population B settles on a large landmass, and subsequently grows and diversifies linguistically. As a result, the average phonemic diversity of population B increases with time. Conversely, the phonemic diversity of population C remains stable through time because it occupies a small, isolated island. Therefore, the phonemic diversity of population C can be used to approximate what the phonemic diversity of population B would have been at time
  Large dots denote high phonemic diversity and small dots denote low phonemic diversity.

