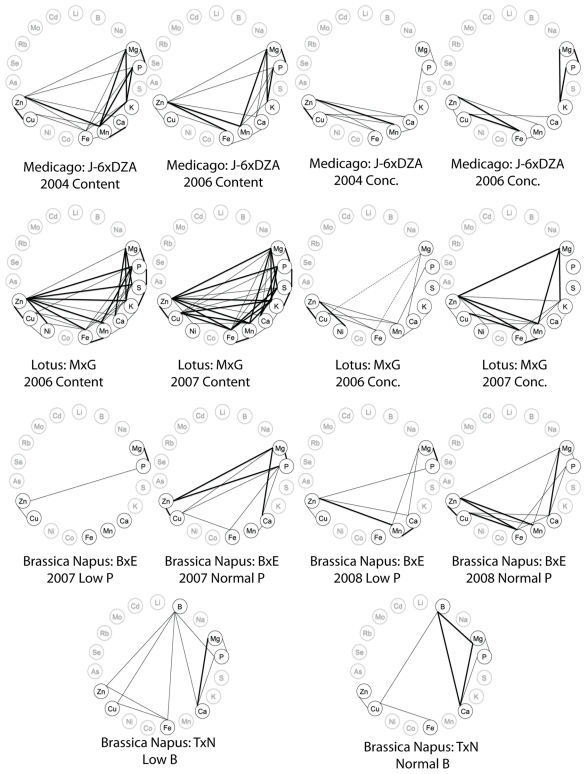
Figure 5. Correlations wheels showing significant correlations between elements within an experiment.
A–D from Sankaran et al. [30] Tables 1 & 2 for the Medicago Truncatula Jemalong-6×DZA315.16 population. E–H from Klein et al. [28] Table 2. For the Lotus Japonicus Miyakojima MG-20×Gifu B-129 population. I–L from Ding et al. [25] Table 2 for the Brassica Napus B104-2Eyou Changjia population. Mn from Liu et al. 29 table 2 for the Brassica Napus TapidorNingyou 7 population. Only significant correlations (p<0.001 and R2>0.32) are displayed on each wheel. Positive correlations are denoted by solid lines, negative correlations are denoted by dashed lines. Thick lines indicate R2>0.5, thin lines indicate 0.32<R2<0.5. Ions not measured in a given experiment are colored in grey.

