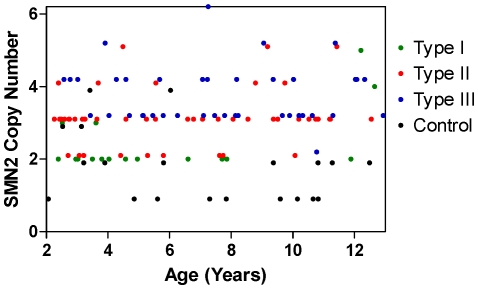
Figure 3. SMN2 copy number relationship to age, and by SMA Type or Control.
Subjects with each SMA type are broadly distributed across the age range, with the exception of type I SMA for whom there is some bias to younger age. As a consequence, SMN2 copy numbers are also broadly distributed. Values have been plotted with a small y-axis offset to avoid overlap of values.

