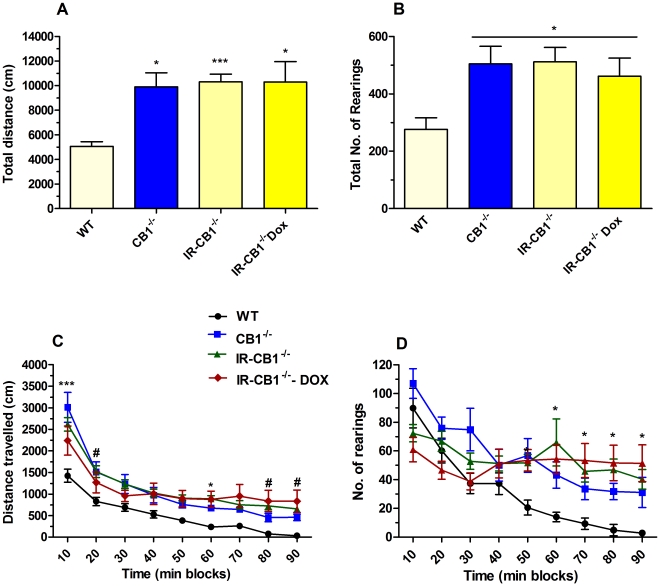
Figure 5. Motor activity in IRh-CB1-/-, CB1-/- and WT mice.
In panel A and C, the total distance (cm) traveled in 90 min and related time course, respectively, are depicted. The vertical activity expressed as total number of rearing episodes and the time course are illustrated in panel B and D, respectively. All data represent the mean±S.E.M. of WT (n = 9), CB1-/- (n = 8), IRh-CB1-/- (n = 22) and IRh-CB1-/-+ Dox (n = 11) mice. For the rearing behavior for some mice the data have been lost (not recorded by the apparatus) and thus the number of mice for the two latter groups is 18 and 9, respectively. ***P<0.001 and *P<0.05 vs WT mice (Dunn’s Multiple Comparison test for total distance, and Newman-Keuls Multiple Comparison test for all the others).

