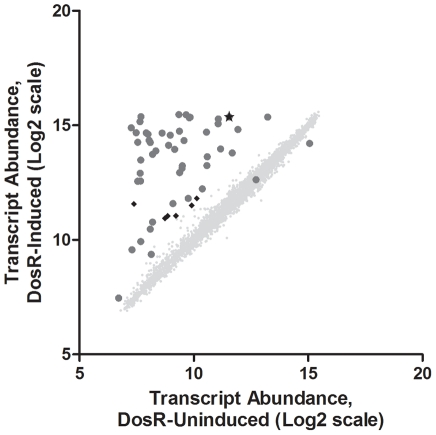
Figure 1. Ectopic expression of DosR induces the DosR regulon.
Scatterplot displaying transcript levels of all M. tuberculosis genes after 24 hours of treatment with either 10 ng/mL Atc (induced) or an equivalent volume of sterile DMSO (uninduced). Three biological replicates were RMA-normalized and the median pixel intensity data are plotted on a log2 scale. Genes of the DosR regulon are represented as dark gray circles. Significantly induced genes (moderated t-test with Benjamini-Hochberg FDR correction, p<0.05) not part of the DosR regulon are presented as black diamonds, and the dosR transcript is indicated with a star.

