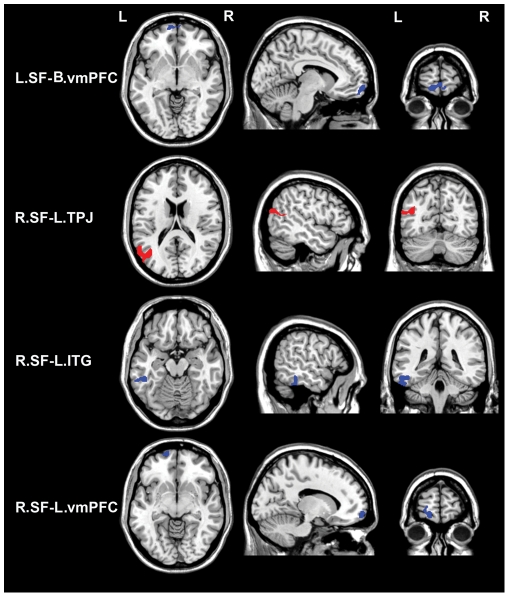
Figure 6. Brain areas in which negative rsFC with the SF is correlated with HA score.
Red colors denote positive correlations while blue colors denote negative correlations. Abbreviations: B, bilateral; rsFC, resting-state functional connectivity; ITG, inferior temporal gyrus; L, left; R, right; SF, superficial subregion; TPJ, temporoparietal junction; and vmPFC, ventromedial prefrontal cortex.

