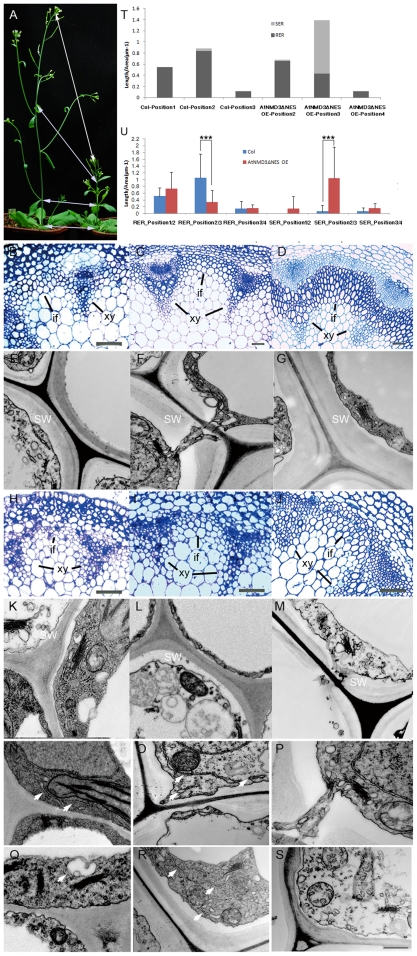
Figure 7. RER formation is reduced in the AtNMD3ΔNES OE line.
A shows the four morphologically comparable positions (1–4, see text) where the stem samples were collected for observation of the secondary cell wall thickening. B to M show the morphological features of xylem and interfascicular fibers at positions 2–4 of the Col-0 (B–D) and AtNMD3ΔNES OE lines (H–J), respectively, and the secondary cell walls at position 2–4 of the Col-0 (E–G) and AtNMD3ΔNES OE lines (K–M), respectively. N to S show dynamic changes of ER (arrow heads) in the interfascicular fiber cells at positions 2–4 of the Col-0 (N–P) and AtNMD3ΔNES OE lines (Q–S), respectively (detailed information see Figure S10 and Table S2). T. Relative length of RER and SER in the interfascicular fiber cells at comparative positions between Col and AtNMD3ΔNES OE lines. U. Comparison of RER and SER in the comparable cells of Col and AtNMD3ΔNES OE lines. (if: interfascicular fiber; xy: xylem; SW: secondary cell wall. Bars for B, C, D, H, I, J = 50 µm; for E, F, G, K-S = 500 nm. P<0.01; Sample numbers for Col position 1: n = 17, Col position 2: n = 24, Col position 3: n = 8, AtNMD3ΔNES OE position 2: n = 19, AtNMD3ΔNES OE position 3: n = 33, AtNMD3ΔNES OE position 4: n = 5).

