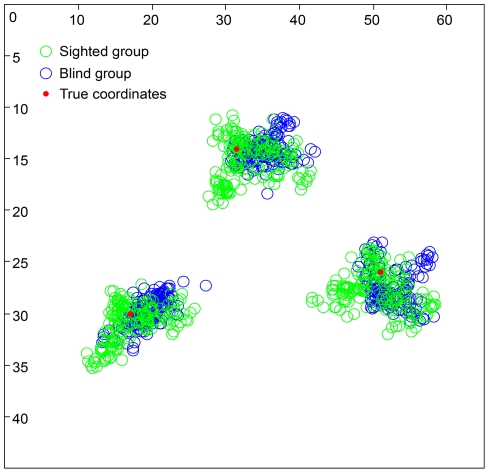
Figure 4. The results from the finger localization task that tested the participants' basic proprioceptive ability (Experiment #3).
The graph illustrates the perceived location of the right index finger on the table, as indicated by the participant moving his or her left index finger under the table. The data from the two different groups are indicated by the different colored circles (sighted: green circles; blind: blue circles). The red circles indicate the actual location of the target right index finger on the table. The values on the x- and y-axes refer to distances from the top left corner of the table in cm. There were no significant differences between the finger-pointing responses in the two groups (see the Results section for additional details about the analysis).

