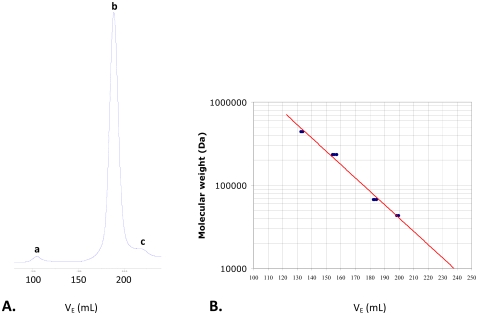
Figure 2. Oligomeric state of native ChrR and the mutants listed in Table 2 as determined by gel-filtration chromatography (Superdex 200 10/300).
Panel A shows absorbance at 280 nm as a function of the elution volume, and Panel B is the calibration curve. The active enzymes are essentially tetrameric (peak b), as the dimer fraction (peak c) and protein aggregates (peak a) are negligible.

